Research Article 
![]() Creative Commons, CC-BY
Creative Commons, CC-BY
Model Fibrillation as an Analogue of the Hyperbolic the Smale-Williams Attractor
*Corresponding author: Sergey T Belyakin, Physics of Faculty, Department of General physics, State University of Moscow, Moscow 119991, Russia.
Received: April 18, 2019; Published: April 29, 2019
DOI: 10.34297/AJBSR.2019.02.000606
Abstract
Currently, active media form a very promising area of research, because they include a variety of physical, chemical, biological, etc. objects: electronic solid-state systems, a number of chemical solutions and gels (including the Belousov reaction), nerve and muscle tissue, microbial colonies, ecological systems, etc. Representation of active media through ensembles linked excitable or self-oscillating elements is quite useful method of analysis, because the active media allows you to deeply understand the basic dynamic processes occurring in such environments. As is known, this approach goes back to the Wiener and rosenbluth Model [1], according to which the excitable medium consists of a set of interacting elements in one of three possible States: excitation, refractoriness or rest.
Later, models such as limit-cycle oscillators and chaotic maps [2-3] also began to play an important role not only in a fairly realistic description of active media, but also in understanding the possible behavior of systems far from equilibrium. Many useful concepts, such as phase captures, synchronization, and space-time chaos, have become popular due to detailed studies of similar nonlinear models [4-6]. Analysis of systems of interacting elements allows us to determine a number of patterns of behavior of active environments, often hidden and implicit. For example, it becomes possible to describe complex (including chaotic) dynamic regimes at a qualitatively different level, to calculate a number of invariant characteristics of the process dynamics and to give a visual representation of the obtained solution.
Introduction
The development of the theory of dynamic systems and computer methods allowed a new approach to the study of such a complex active medium as heart tissue. The combined use of these two approaches, as well as the consideration of cardiac tissue as a system consisting of self-oscillating and excitable elements, makes it possible to deeply understand the processes underlying the functioning of the heart and describe the various cardiac pathologies (arrhythmias). One of the very relevant and practically important directions here is the task of stabilizing the work of the heart muscle in some types of deep arrhythmias [7,8]. Stabilization of unstable or chaotic behavior of a dynamic system, creation of artificial in the studied system of stable periodic oscillations, by means of external multiplicative or additive influences. To stabilize, it is necessary to find such external disturbances that would bring the system out of the chaotic regime on a regular one. To solve these problems, there is, at present, sufficient scientific interest. The relevance of this problem in the application to active environments is obvious. For example, for cardiac tissue, the removal of the system to the desired dynamic mode makes it possible to control the rhythm and thus restore the required dynamics. This approach to the stabilization of dangerous arrhythmias allows us to hope for the creation of new effective rhythm drivers. At the same time, it is important to minimize energy costs, since the application of pulses of large amplitude to biological tissues is unacceptable.
Chaos Suppression and Cardiac Arrhythmia
Heart muscle refers to excitable systems. Wave propagation in such systems is carried out by means of an energy source distributed in it. When a pulse is applied to such a system, a disturbance begins to propagate from the place of its application, an excitation wave: the incoming pulse is transmitted sequentially from element to element without fading. Usually, after the excitation of each element is not able to immediately be excited again, there is a certain “relaxation time”, called the refractory period, during which the element is restored. This lead, on the one hand, to an ordered spatial propagation of the excitation wave, and on the other hand, with frequent supply of pulses (or with a large period of refractoriness), some of them will be blocked.
Suppose that there is a homogeneous excitable medium in which all elements have identical properties. Then the excitation frequency of all such elements will be the same. If some area of this environment to start periodically to perturb, in this region there is a source of concentrically radiating waves of excitement. Such a source is called a leading center or pejjsmeker. If an excitable medium is two or more pacemaker, pejjsmeker less of the oscillation frequency with time is suppressed by pejjsmeker greater frequency. In other words, there is competition between pacemakers. Ideally, after a certain time throughout an environment will be only one pejjsmeker Fig.1A. In addition to pacemakers, in excitable media, other sources of excitation of spiral waves may appear, which are “rotating” spirals. All spiral waves have the same frequency. Therefore, they always coexist with each other, but extinguish the leading center, which is a slower autowave source. Spiral waves are the main type of elementary self-supporting structures in homogeneous excitable media, like vortices in a superconductor or in superfluid helium, and they are extremely stable (Figure 1).

Figure 1:Single helical wave (a) and multiple co-existing helical waves (b).
The appearance of several sources of excitation in the heart muscle is currently associated with dangerous disorders of the normal functioning of the heart --- arrhythmia. With many abnormal sources, Figure fibrillation occurs 1b.
Fibrillation is a dangerous violation of the heart rhythm, due to the appearance of many small waves in the heart tissue. This process can develop due to several reasons. One of them is the appearance of periodic stimulation of myocardial areas. In this case, fibrillation occurs after the cessation of stimulation in a medium with a variable refractory period. If, for one reason or another, the heart received a pulse in the critical phase (during the refractory period of the ventricles), it will generate a wave crossing the refractory zone. Then the ends of the excitation wave can twist, giving rise to spiral waves rotating in opposite directions.
Modern methods of removing the heart from the state of fibrillation are very rigid (supply of a short electrical pulse of a huge voltage and a large current). The development of nonlinear dynamics and synergetics made it possible to understand that such a force effect is not necessary. Often enough weak electrical effects directly on the heart muscle. Precisely, if there are spiral waves with opposite directions of rotation in the medium, then, choosing the phase and frequency of external action, it is possible to achieve the movement of the centers of the two waves towards each other and their annihilation.
Cardiac Conduction System
Normally, the excitation of the heart muscle originates in the sinus, or sinoatrial node (ACS), covers the myocardium of the Atria and, passing the atrioventricular node (AVA), extends along the legs of the bundle of GIS and Purkinje fibers to the ventricular myocardium (Figure 2). Thus, the normal heart rate is determined by the activity of a group of conducting P-cells of the ACS, which is called a first-order rhythm driver (it produces 60-90 UTIs/ min), or a true pacemaker. In addition to the cells of the sinus node automaticity inherent in the other structures of the conduction system of the heart. Pacemaker of the second order (40-60 impulses/min) localized in the NH area AVA. A pacemaker third order (20-40 CPM) are the cells of Purkinje, forming part of the conduction system of the ventricles. Due to the “law of the gradient of automatie” the activity of the underlying drivers of a rhythm is suppressed in the normal sinoatrial node. Therefore, the pacemaker second and third order are called latent (or potential) pacemaker.

Figure 2: Cardiac conduction system. Sinoatrial Node (SAN) sinoatrial node; Right Atrium – right atrium; Atrioventricular Node (AVN) – atrioventricular node; Right Bundle Branch (RBB) –right leg of bundle branch block, Right Ventricle – right ventricle; Left Atrium – left atrium; His Bundle – bundle branch block; Left Bundle Branch (LBB) left leg of bundle branch block, Left Posterior Fascicle (LPF) – left rear bundle of fibers; Left Ventricle – left ventricle; Left Anterior Fascicle (LAF) – left front bundle of fibers; Purkinje Fibers (PF) – Purkinje fibers.
Fibrillation
In a healthy heart, refractoriness provides a normal sequence of propagation of excitation into the heart and electrical stability of the myocardium. Since the area of the myocardium through which the excitation passes becomes unresponsive for some time, re-entry of the excitation into this area is impossible. Due to this, the counter waves in the myocardium mutually “extinguish” each other, which prevents, in particular, the appearance of unwanted circulation of excitation. However, in the final stage of each excitation cycle, the myocardium becomes inhomogeneous in refractoriness for a short time and loses electrical stability. Stimulus, acting at this time, can lead to serious violations of the normal course of excitation, in particular to the emergence of circulating excitation waves by the mechanism of “re-entry” (re-entry) [9].
Sharp violations of the normal ratio of excitability and refractoriness can lead to the formation of a large number of reentrant waves in the myocardium, which are spiral waves (Figure 1b) on the surface of the heart and complete desynchronization and discoordination of the activity of the myocardial fibers when they begin to excite and contract independently. This condition is called fibrillation and is accompanied by almost complete loss of pumping function of the corresponding part of the heart.
The theory of dynamic systems describes many processes inherent in active media, including some types of arrhythmias [10]. Since arrhythmias are caused by certain disorders in the heart muscle and, therefore, are pathological conditions, the modeling of such systems is of great practical interest and can bring closer to solving the problem of the possibility of controlling their behavior through external influences. This, in turn, allows us to come close to the problem of soft withdrawal of active systems from the state of developed space–time chaos characterizing some types of pathologies [11-13].
A current model based on an Autonomous dynamic system with a hyperbolic attractor of the Smale-Williams type
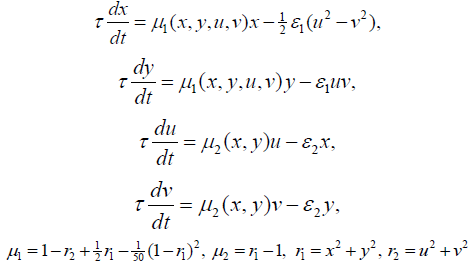
An electronic device based on an Autonomous dynamic system with a hyperbolic attractor of the Smale-Williams type (Figure 3 & 4). Each of the four dynamic variables x, y, u, v is associated with a fragment of the circuit, which is an integrator based on the operational amplifier (respectively, U1, U2, U3, U4), capacitance (C1, C2, C3, C4) and resistance (R13, R14, R16, R17). The actual values of x, y, u, v correspond to the voltages on the capacitors C1, C2, C3 and C4, respectively. The constant with the dimension of time is determined by the capacitance and resistance, and at the values specified in the scheme, is MS. For the presented scheme, the coupling coefficients are. The implemented electronic device is described by the equation (1):

Figure 3: Scheme of the device, the dynamics of which is described by a system of equations (94) with coefficients and parameters MS. Dynamic variables x, y, z, v correspond to voltages on capacitors C1, C2, C3, C4, measured in decivolts. Implemented electronic device ((Figure 3), which is an Autonomous dynamic system with a hyperbolic attractor of the Smale-Williams type. An experimental study of the laboratory model of the hyperbolic chaos generator was carried out and the observed dynamics was demonstrated to correspond to the results of numerical calculations and circuit simulation in the Multisim software environment (together with the lab. SF-6) (Figure 4) [14,15].

Figure 4: Experimental study of the laboratory layout of the hyperbolic chaos generator and demonstrated the compliance of the observed dynamics with the results of numerical calculations and circuit simulation in the Multisim software environment.
To study fibrillation, we use a model with feedbacks and time delay
(Figure 5) The system (1) with the addition of a demonstration model of fibrillation will take the form presented by the equation (2):

Figure 5: Demonstration model of fibrillation.
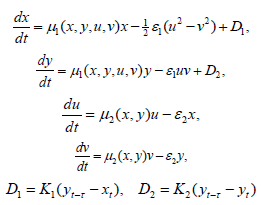

Figure 6: Time and phase portraits of the hyperbolic attractor at K1 = 0.0 & K2 = 0.0 ... 0.1 ... 0.3 are presented.

Figure 7: Time and phase portraits of the hyperbolic attractor at K1 = 0.0 & K2 = 0.4 ... 0.9 are presented.

Figure 8: Time portraits of hyperbolic attractor at K1 = 0.0 & K2 = 1.0 ... 1.7 ... 2.0 are presented.
Analysis of the demonstration model of fibrillation presented by equation (2) for K1 = 0.0. Analysis of the demonstration model of fibrillation, for K1 = 0.0 showed, at K2 = 0.1 comes the synchronization observed in the phase portrait Figure 6, at K2 = 0.1 ... 1.6 synchronization is observed in the phase portrait Figure Figure 6-Figure 8, at K2 = 1.7 relaxation hyperbolic chaos.
The analysis of the demonstration model of fibrillation presented by the equation (2) for K2 = 1.7 is carried out (Figure 9-Figure 12).

Discussion
Analysis of the demonstration model of fibrillation, for K2 = 1.7 showed, at K1 = 0.4 comes the synchronization observed in the phase portrait Figure 10, at K1 = 0.4 ... 1.5 synchronization is observed in the phase portrait Figure 6-8, at K1 = 1.7 hyperbolic chaos (fibrillation), at K1 = 1.8 relaxation hyperbolic chaos. In rice.9, presents real ECG data [27,28], which can be used to study and predict the behavior of heart failure current models. In fig.10 – 12, various behaviors of the system (19), which can be used in the presentation of different heart failure, are considered.

Figure 10: Time and phase portraits of the hyperbolic attractor at K1 = 0.1 ... 0.4 ... 0.6 & K2 = 1.7 are presented.

Figure 11: Time and phase portraits of the hyperbolic attractor at K1 = 0.7 ... 1.2 & K2 = 1.7 are presented.

Figure 12: Time and phase portraits of the hyperbolic attractor at K1 = 1.3 ... 1.5 ... 1.8 & K2 = 1.7 are presented.
Acknowledgements
This work is supported, in part, by the efforts of Dr. Kuznetsov Sergey P., Professor and Chairman of Faculty of Nonlinear Processes, Department of Dynamic Systems, State University of Saratov, Saratov 410012, Russia.
References
- Wiener N, Rosenblueth A (1946) The mathematical formulation of the problem of conduction of impulses in a network of connected excitable elements, specifically in cardiac muscle. Arch Inst Cardiologia de Mexico 16(3): 205-265.
- Shibata T, Kaneko K (1998) Collective chaos. Phys Rev Lett 81: 4116- 4119.
- Kaneko K (1990) Clustering, coding, switching, hierarchical ordering, and control in a network of chaotic elements. Physica D 41: 137-172.
- Kuramoto Y (1984) Chemical Oscillations, Waves, and Turbulence. Springer-Verlag, Berlin.
- Kuramoto Y (1995) Scaling behavior of turbulent oscillators with nonlocal interaction. Prog Theor Phys 94: 321-330.
- Winfree AT (2000) The Geometry of Biological Time. (2nd edn), Springer- Verlag, New York, USA.
- Zipes DP, Jalife J Orlando (1985) Cardiac Electrophysiology and Arrhythmias. Grune and Stratton, New York, USA.
- Zipes DP, Jalife J (2004) Cardiac Electrophysiology-from Cell to BedSide. (4th edn) WB Saunders, Philadelphia, USA.
- Clayton R, Zhuchkova E, Panfilov A (2006) Phase singularities and filaments: Simplifying complexity in computational models of ventricular fibrillation. Prog Biophys Mol Biol 90: 378-398.
- Beuter A, Glass L, Mackey MC, Titcombe MS (2003) Nonlinear Dynamics in Physiology and Medicine. Springer-Verlag, New York, USA.
- Witkowski FX, Penkoske PA, Plonsey R, Kaplan DT, Spano ML, et al. (1995) Development of a nonlinearly deterministic signal generator for real time chaos control testing. Eng in Medicine and Biology Soc. IEEE 17th Ann Conf, 1: 287-288.
- Brandt ME, Guanrong Chen (1996) Feedback control of a quadratic map model of cardiac chaos. Int J Bifurcation and Chaos 6(4): 715-723.
- Garfinkel A, Spano ML, Ditto WL (1992) Controlling cardiac chaos. Science 257: 1230-1235.
- SP Kuznetsov, A Pikovsky (2007) Autonomous coupled oscillators with hyperbolic strange attractors. Physica D232: 87-102.
- SP Kuznetsov (2005) Example of a Physical System with a Hyperbolic Attractor of the Smale-Williams Type. Phys Rev Lett 95: 144101.
- Nabil El-Sherif, Gioia Turitto (2011) Electrolyte disorders and arrhythmogenesis. Cardiology Journal 18(3): 237-241.
- ST Belyakin, SA Shyteev (2018) The current model of cardiac arrhythmia based on an autonomous dynamical system with a Smale - Williams hyperbolic attractor. Biomedical Journal of Scientific & Technical Research 10(5): 1-8.


 We use cookies to ensure you get the best experience on our website.