Research Article 
![]() Creative Commons, CC-BY
Creative Commons, CC-BY
Computer-Aided System Based on Deep Learning for Lymph Node Lesions Diagnosis in CT Images from Abdominal Lymphadenopathy Patients
*Corresponding author: Ehab I Mohamed, Department of Medical Biophysics, Medical Research Institute, University of Alexandria, Alexandria, Egypt.
Received: September 16, 2023; Published: September 25, 2023
DOI: 10.34297/AJBSR.2023.20.002684
Abstract
Computer-aided diagnosis (CAD) systems have enormous potential in medical imaging and diagnostic radiology, assisting radiologists in acquiring, managing, storing, and reporting digital medical images from various imaging techniques. In lymphadenopathy, the sole criterion to determine an abnormal lymph node is enlarged size; yet CT cannot display abnormal architecture in a normalsized node, which is the most significant shortcoming of the technique and a source of most false-negative results from CT examinations. We employed the deep convolutional neural network ResNet-34 to classify lymph node lesions in CT images from Abdominal Lymphadenopathy patients and Healthy Controls. We created a single database containing 1400 source CT images for Abdominal Lymphadenopathy patients (n=700) and Healthy Controls (n=700). Images were resized, normalized, and arranged in m batches of 16 images before supervised training, testing, and cross-validation of the ResNet-34, to identify and label lesions with automatic volume delineation of target areas. The ResNet-34 had high diagnostic accuracy, with an AUC of 0.9957 for Abdominal Lymphadenopathy and 1.00 for Healthy Control. Thus, the two groups had identically high sensitivity and specificity values of 99.57% and 100%. The added effect of ResNet-34 is a success rate of 99.57% and 100% for classifying random CT images, with an overall accuracy of 99.79% in the testing subset for classifying lymph node lesions. We believe the final layer of ResNet-34’s output activation map is a powerful tool for diagnosing lymph node lesions of lymphadenopathy from CT images because of its high classification precision.
Keywords: Deep Convolutional Neural Networks (DCNN); ResNet-34; Abdominal lymphadenopathy; Computed Tomography (CT)
Introduction
The abnormal size or consistency of the lymph nodes is known as lymphadenopathy, a disease with many different etiologies, including infections, autoimmune diseases, malignancies, histiocy tosis, storage diseases, benign hyperplasia, medications, and iatrogenic causes [1]. Patients with widespread lymphadenopathy, defined as the growth of more than two noncontiguous lymph node groupings, frequently signify an underlying systemic illness [1,2]. Abdominal pain, back pain, increased urination frequency, constipation, and intestinal obstruction brought on by intussusception are all potential signs of mesenteric lymphadenopathy, even though they are not typically visible on physical examination [1]. Mesenteric adenitis is assumed to have a viral etiology and is characterized by right lower quadrant abdominal pain brought on by nodal swelling close to the ileocecal valve, which makes it difficult to distinguish from appendicitis [3]. Others include the etiologies of typhoid fever, ulcerative colitis, and non-Hodgkin lymphoma [3,4]. Lymphoma frequently results in lymphadenopathy in the chest, retroperitoneum, or superficial lymph node chains; however, mesenteric lymphadenopathy is not uncommon [5]. Enlarged nodes may be seen at the mesenteric root, scattered throughout the peripheral mesentery, or mixed root-peripheral pattern [6]. Early in the disease, the lymph nodes may be small and discrete; upon disease progression, the nodes often merge, forming a conglomerate soft-tissue mass. Lymphoma is a soft tissue tumor, and extensive mesenteric lymphadenopathy due to lymphoma has a characteristic appearance [7].
State-of-the-art present-day Computed Tomography (CT) scanners offer excellent contrast and spatial resolution, which frequently allows for the visualization of healthy retroperitoneal and mesenteric lymph nodes [2]. It is known that the sole criterion to determine if a lymph node is abnormal is enlarged size; CT cannot display abnormal architecture in a normal-sized node [8], which is the most significant shortcoming of the technique and a source of most false-negative results from CT examinations [7]. Additional false-negative results are artifacts due to partial volume averaging and variable respiratory excursions. The radiologist interprets enhanced abdominal CT images and determines whether lymphatic metastasis has occurred based on the lymph nodes’ texture, shape, size, and morphology [9]. However, it often remains challenging for the radiologist to make correct and timely decisions by combining the above-described features, especially for significant cases for which the accuracy of diagnosis certainly decreases, and errors are likely to occur [7,9]. Therefore, it is necessary to develop more convenient, faster, and more accurate systems that can assist radiologists in quickly identifying perigastric metastatic lymph nodes.
Artificial intelligence-assisted image recognition techniques are currently able to detect the target area of an image and make classifications according to target features, which is like the diagnosis process of the radiologist. Specifically, computer-aided diagnosis (CAD) systems have proven useful in medical imaging and diagnostic radiology, improving accuracy, improving interpretation consistency, helping prognostic evaluation, and supporting the therapeutic decision-making process from various imaging techniques (e.g., CT, MRI, US, and CR) [15,16]. More precisely, CAD systems rely on pattern recognition algorithms that identify suspicious features on an image in clinical practice, assisting radiologists in detecting potential abnormalities on diagnostic radiology exams. CAD systems using Deep Convolutional Neural Networks (DCNN) successfully diagnosed COVID-19 patients from chest X-ray images and cervical lymph nodes in CT images [10,11].
This research aimed to employ the DCNN ResNet-34 for identifying and classifying lymph node lesions in CT images from Abdominal Lymphadenopathy patients and Healthy Controls.
Materials and methods
Study Population Database and Sample Size
An expert radiologist referred to the diagnosis of Abdominal Lymphadenopathy of CT images as the gold standard based on the location, shape, size, number, type, and extent of lymph node lesions due to infections, autoimmune diseases, malignancies, histiocytosis, storage diseases, benign hyperplasia, medications, and iatrogenic causes. We created a database containing a sample size of 1400 source CT images from online anonymous Abdominal Lymphadenopathy patients (n = 700) and Healthy Controls (n = 700), reaching a 99% confidence level and a 1% error margin for the designated DCNN model. The Ethics Committee of the Medical Research Institute, Alexandria University, approved the study protocol.
Deep Convolutional Neural Network Model Selection
Transfer learning is an affordable deep learning algorithm for supervised machine learning that utilizes less training data and has better generalization. A new DCNN for image recognition has been created by modifying the activation function Softmax and the classification layer using transfer learning applied to a pre-trained Residual Neural Network (ResNet) [10]. Using a benchmark DCNN model with a 3.6% error rate [12], we trained, validated, and tested the supervised pre-trained ResNet-34 to classify the study database of 1400 CT images. We employed the Adam optimization algorithm to train a multilayer feed-forward ResNet-34 model with backpropagation of errors, adjusting the learning rate to 10-3 and using a batch size of 16 random CT images (i.e., of Abdominal Lymphadenopathy or Healthy Controls). The computational complexity of the ResNet-34 structure is moderate, with top-1 and top-5 errors of 26.70 and 8.58, respectively [13]. Finally, we tested the model on a MacBook Pro with Mojave 10.14.6 operating on an Intel i7-core @ 3.0 GHz processor and 16 GB RAM using the PyTorch Library (Anaconda Inc., New York, USA) [10].
As previously described, we used the Gradient-Weighted Class Activation Map (Grad-CAM) to locate and highlight a crucial region of interest, designating certain lymph node lesions with automatic volume delineation and 3D reconstruction of target areas for a certain category in an input CT image [10]. Grad-CAM employs a target class’s gradient information that flows back into the last convolutional layer of the ResNet-34 to create class activation maps from the residual block (Figure 1A and 1B), where it fed the globally averaged pooled convolutional feature maps into the last output layer to produce visual explanations, defined by Eq. 1 [14]:

Figure 1: Block diagrams of a regular Convolutional Neural Network (CNN) (A), a residual Deep Convolutional Neural Network (DCNN) (B), and the arrangement of a three-step pipeline for the detection and classification of CT images using DCNN (C).
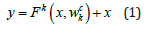
where x and y are the building block’s input and output vectors,
respectively,  is the residual mapping,
  is
the global average pooling spatially averaging the k-th feature map
with width and height u * v obtained from the last convolution layer
of the DCNN, and
is
the global average pooling spatially averaging the k-th feature map
with width and height u * v obtained from the last convolution layer
of the DCNN, and  is the weight that connects the k-th feature
map to a corresponding class c output node. Regarding the residual
block depicted in Fig. 1B, F is given by Eq. 2:
is the weight that connects the k-th feature
map to a corresponding class c output node. Regarding the residual
block depicted in Fig. 1B, F is given by Eq. 2:

ReLU(.) is for a rectified linear unit, which is Eq. 3 gives:

The prediction score, which serves as input to the activation function Softmax at the output layer Sc, may be given as a weighted sum of the global average pooling for the k-th feature map from the following Eq. 4:

fk(x, y) denotes the spatial element (x, y) activation in the k-th
feature map. The class activation map of class  is the
weighted sum of all feature maps’ activations at spatial element (x, y).
is the
weighted sum of all feature maps’ activations at spatial element (x, y).

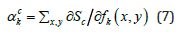
The Grad-CAM for class c is the weighted sum of all feature maps produced by the last convolution layer in a DCNN. Given that the spatial elements in the feature maps associated with the negative weights were likely to belong to other categories in the image, the ReLU function (Eq. 3) was used to eliminate any potential influence from negative weights on class c as given by Eq. 6:
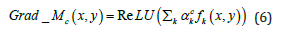
where  is the weight obtained by computing the gradient of a
prediction score Sc as given by Eq. 7:
is the weight obtained by computing the gradient of a
prediction score Sc as given by Eq. 7:
The ResNet-34 block diagram for detection and classification is shown in Fig. 1C, which consists of a three-step pipeline for 1) detecting random CT images, where the first layers detect edges and shapes, while the last layers work on the details; 2) identifying all suspicious lesions in the abdominal CT image; and 3) classifying Abdominal Lymphadenopathy patients from Healthy Controls.
All CT images were resized to 224 × 224, normalized, and arranged in m batches of 16 images to match the input requirements standards of the ResNet-34. The 1400 CT images were randomly divided into 88 batches of 16 images, where training was carried out using 53 image batches (60%), validation using 18 batches (20%), and testing using the remaining 18 batches (20%). Passing CT image batches through the ResNet-34 for training, batch normalization between skips double- or triple-layers containing nonlinearities for image classification [14]. The performance of the ResNet-34 was monitored as the training loss, validation loss, and error rate along with epochs. The receiver operating characteristic (ROC) curve, the area under the curve (AUC), the sensitivity and specificity analysis, and the confusion matrix for actual vs. predicted Abdominal Lymphadenopathy and Healthy Control CT image values were used to evaluate the classification accuracy. Finally, K-Fold cross-validation tests were conducted to classify all source CT images from Abdominal Lymphadenopathy patients and Healthy Controls, divided equally randomly among each one-to-five-fold.
Results
Figures 2A to 2C show the performance of the ResNet-34 model, where the training and validation loss of random subsets of CT images and the error rate with the number of epochs converge at the end of the training phase. Sixty-two epochs were sufficient to avoid under and over-fitting, reflecting the high precision of testing the subset of random CT images used to detect and classify lymph node lesions. Figure 2D shows that the accuracy score of the training, testing, and validation phases attained maximum values beginning at epoch 62.

Figure 2: Deep Convolutional Neural Network (DCNN) ResNet-34 performance as Training Loss (A), Validation Loss (B), Error Rate (C), and Accuracy Score of the three learning phases (i.e., Training, Testing, and Cross-Validation) (D) for Abdominal Lymphadenopathy patients and Healthy Controls CT images.
Fundamental measures of the diagnostic accuracy of the Res- Net-34 model, as of ROC curves of the true-positive rate versus the false-positive rate, for Abdominal Lymphadenopathy patients and Healthy Control CT images, are shown in Figure 3A and 3B. AUC values for Abdominal Lymphadenopathy patients and Healthy Controls were 0.9957 and 1.00, which signify a perfect accuracy in the diagnosis and identical sensitivity and specificity values of 99.57% and 100% for the two groups, respectively, with an error rate of 5.39 × 10⁻³ by three-fold cross-validation test, as shown in Table 1. The ResNet-34 achieved a high average accuracy of 99.30% and a low error rate of 6.9 × 10⁻³ in classifying all source CT images.

Figure 3: The receiver operating characteristic (ROC) curve analysis of sensitivity against 1-specificity for Abdominal Lymphadenopathy patients (A) and Healthy Controls (B) CT images.
Moreover, the confusion matrix of Figure 4 shows that the ResNet-34 had a success rate of 99.57 and 100% for classifying all source CT images of Abdominal Lymphadenopathy patients and Healthy Controls, respectively. The overall accuracy of the Res- Net-34 for testing the subset of random CT images was as high as 99.79%, which means an error rate as low as 0.21%. Figures 5A and 5B show samples of input CT grayscale images batch for Abdominal Lymphadenopathy patients and Healthy Controls. Figures 5C and 5D also show samples of the colored activation map of the ResNet-34 final output layer for the two different subsets. The activation map is a proper visual diagnostic representation, highlighting specific lymph node lesions of a CT image, contributing to the added effect of the ResNet-34 classification process.

Figure 4: Confusion matrix of detection and classification results for Abdominal Lymphadenopathy patients and Healthy Controls CT images.

Figure 5: Example of input grayscale CT images for an Abdominal Lymphadenopathy patient (A) and a Healthy Control (B). Output colored activation maps of the same CT images for an Abdominal Lymphadenopathy patient (C) and a Healthy Control (D).

Table 1: Accuracy and error rate of K-Fold cross-validation tests.
Discussion
Lymphadenopathy is a broad term describing lymph node pathology that does not necessarily result in increased size but includes its atypical number and derangement of internal architecture [1,2]. Moreover, it has been shown that 5%-10% of CT-detected abdominal lymphadenopathy cases are related to benign processes rather than malignant infiltration. Unfortunately, no distinctive features distinguish benign from malignant lymphadenopathy since individual nodes greater than 2 cm and confluent node mantles may be seen in benign diseases [4, 5, 7, 9]. Our proposed CAD system based on the ResNet-34 model showed a very high performance due to the convergence of the training loss, validation loss, and error rate to a minimum (i.e., zero) (Figure 2A to 2C). The ResNet-34 builds on constructs from pyramidal cells in the cerebral cortex using skip connections or shortcuts to jump over some layers, which permits the advantageous reduction of over-fitting and leads to faster optimization and better performance of the DCNN model. Only 62 epochs were sufficient to attain a high and stable accuracy score of training, testing, and cross-validation of random CT images without under or over-fitting (Figure 2D).
The AUC analysis of ROC curves (Figures 3A and 3B) of true-positive rate (i.e., sensitivity) versus false-positive rate (i.e., 1-specificity) showed that points in the upper left corner signify sensitivity and specificity as high as 99% and 100% for Abdominal Lymphadenopathy and Healthy Controls, respectively, by three-fold cross-validation test (Table 1). These results outperform those by Liu, et al., [17]. They proposed a CAD system based on a 3D blob enhancement filter for automatically detecting enlarged lymph nodes in contrast-enhanced abdominal CT images from 9 patients compared to the original multi-scale Hessian analysis performance. Their method achieved a sensitivity and false-positive rate of 91% and 17% compared to 82% and 28% for the multi-scale Hessian analysis. Bejnordi, et al., [18] compared the efficiency of automated DCNN algorithms to pathologists’ diagnoses for detecting metastases in lymph nodes from breast cancer patients stained with hematoxylin and eosin. They have shown that some DCNN algorithms achieved better diagnostic performance than a panel of the 11 pathologists who participated in the simulation exercise designed to mimic routine pathology workflow. The best algorithm attained a lesion-level true-positive fraction of 72.4% at a mean of 0.0125 false positives per typical whole-slide image, which is equivalent to the pathologists without time limitations. The AUC of the best algorithm for the whole-slide image classification task was 0.994, which performed significantly better than the pathologists (0.810, p < 0.001) with time constraints in a diagnostic simulation. Moreover, the performance of the 5 best algorithms was comparable with an expert pathologist (AUC: 0.960 vs. 0.966) interpreting whole-slide images without time constraints, yet; their approach was not evaluated in a clinical setting.
The added effect due to the success rate of the ResNet-34 was 99.57% and 100% for classifying all source CT images of Abdominal Lymphadenopathy and Healthy Controls, respectively (Figure 4). The overall accuracy of the ResNet-34 for testing the subset of random CT images used for the detection and classification of lymph node lesions was as high as 99.79%, with a very low error rate of 0.21% in the testing phase compared to the 3.6% showed for the benchmarked ResNet-34 [12]. We have recently shown similar results using the same ResNet-34 model, which showed high performance and precision in detecting and classifying COVID-19, pneumonia, and the Normal Controls from CXR images with an accuracy of 100%, 99.6%, and 98.9, with overall accuracy of 99.5% for the testing subset for diagnosis [10]. We employed the Grad- CAM method to localize and visualize an ROI within CT images, consistently highlighting a specific area common in shape, pattern, or location among CT images within the same class but distinct from images in other modality classes [14]. The activation map (Figures 5C and 5D) is thus an informative visual diagnostic representation, highlighting certain morphological anomalies of lymph nodes in a CT image, contributing the most to the ResNet-34 classification process.
The problem of classifying gastrointestinal polyps using a stacking ensemble technique consisting of three fine-tuned DCNN architectures; Xception, ResNet-101, and VGG-19; where the network weights were initialized from the ImageNet dataset has been recently addressed [19]. Endoscopic image enhancement operations have been applied to remove specular reflection, clipping unnecessary regions, contrast enhancement, and noise reductions. An accuracy of 98.53%, a recall score of 96.17%, a precision value of 92.09%, a specificity score of 98.97%, and an AUC of 0.99 were attained using five-fold cross-validation. Thus, the specified polyp’s classification method showed significantly improved performance metrics on available public datasets, which could be helpful for endoscopists to make accurate decisions.
The DenseNet-169 CNN model has also been employed successfully to analyze digitized slides of prophylactic gastrectomy specimens from seven patients with germline CDH1 mutations to detect 133 carcinoma foci, which achieved an AUC of 0.9986 on individual patches and 0.9984 on the external validation dataset [20]. The model had a sensitivity of 90% with a false-positive rate of less than 0.1%. The network detected 100% of carcinoma foci on whole slide images, correctly eliminating an average of 99.9% of the non-cancer slide area from consideration. Moreover, Liu, et al., [21] have successfully employed a 3D U-Net model for automatically detecting and segmenting lymph nodes on 393 pelvic diffusion- weighted imaging images for patients suspected of prostate cancer. The dice score, true positive rate, positive predictive value, volumetric similarity, Hausdorff distance, average distance, and Mahalanobis distance values for the segmentation of suspicious lymph nodes were 0.85, 0.82, 0.80, 0.86, 2.02, 2.01, and 1.54 mm respectively. For identifying suspicious lymph nodes, the precision, recall, and F1-score were 0.97, 0.98, and 0.97, respectively. The AUC of the model for identifying prostate cancer patients with suspicious lymph nodes in the temporal validation dataset was 0.96, with high consistency of lymph node staging in both the model and an experienced radiologist (k = 0.92). Furthermore, Iuga, et al., [22] have also recently developed an automatic tool for the 3D detection and segmentation of lymph nodes in 89 contrast-enhanced CT scans of the thorax using a DCNN U-Net based on 3D foveal patches. The algorithm achieved good overall performance with a total detection rate of 76.9% for enlarged lymph nodes during four-fold cross-validation in the training dataset, with 10.3 false positives per volume and 69.9% in the unseen testing dataset. A better detection rate was observed in the training dataset for enlarged than smaller lymph nodes; the detection rates for lymph nodes with a short-axis diameter ≥ 2 cm and 0.5-1cm were 91.6% and 62.2% (p < 0.001), respectively. The best detection rates for lymph nodes in Level 4R and Level 7 were 83.6% and 80.4%, respectively.
Conclusion
A highly expert radiologist is required to diagnose lymph node lesion morphological anomalies in CT images. We employed the ResNet-34 to detect and classify CT images of Abdominal Lymphadenopathy patients and Healthy Controls. Images were resized, normalized, without any image augmentation, and arranged in m batches of 16 images before supervised training and validation of the DCNN classifier. The added effect of the ResNet-34 model is a success rate of 99.57% and 100% for classifying random CT images of Abdominal Lymphadenopathy patients and Healthy Controls, with an overall accuracy of 99.79% in the testing subset for detecting and classifying lymph node lesions. Based on this high classification precision, we believe the output activation map of the final layer of the ResNet-34 is a powerful tool for accurately diagnosing Abdominal Lymphadenopathy from CT images.
Acknowledgments
The authors thank Dr. Atef K. Khamis for his professional assistance in preparing the CT images database for Abdominal Lymphadenopathy patients and Healthy Control.
Statements and Declarations
Competing Interests
All authors certify that they have no affiliations with or involvement in any organization or entity with any financial interest or non-financial interest in the subject matter or materials discussed in this manuscript.
Funding
All authors declare they received no financial support for conducting this research.
Author Contributions
Conceptualization: [Radwa A. Meshref and Ehab I. Mohamed], Methodology: [Safa A. Elaskary, Ahmed M. Eldrieny, Israa A. Saleem, and Amgad A. Salama], Formal analysis and investigation: [Radwa A. Meshref, Safa A. Elaskary, Ahmed M. Eldrieny, Amgad A. Salama, and Ehab I. Mohamed], Writing - original draft preparation: [Radwa A. Meshref, Safa A. Elaskary, Ahmed M. Eldrieny, Israa A. Saleem, and Amgad A. Salama]; Writing - review and editing: [Ehab I. Mohamed], Supervision: [Ehab I. Mohamed].
References
- Gaddey HL, Riegel AM (2016) Unexplained lymphadenopathy: Evaluation and differential diagnosis. Am Fam Physician 94: 896-903.
- Maini R, Nagalli S (2022) Lymphadenopathy. Treasure Island (FL): StatPearls Publishing.
- Alvarado A (2018) Clinical approach in the diagnosis of acute appendicitis. In: Garbuzenko DV. (Editor). Current Issues in the Diagnostics and Treatment of Acute Appendicitis. London: Intech Open.
- Spijkers S, Staats JM, Littooij AS, Nievelstein RAJ (2020) Abdominal lymph node size in children at computed tomography. Pediatr Radiol 50(9): 1263-1270.
- Yu RS, Zhang WM, Liu YQ (2006) CT diagnosis of 52 patients with lymphoma in abdominal lymph nodes. World J Gastroenterol 12(48): 7869-7873.
- Helbling R, Conficconi E, Wyttenbach M, Benetti C, Simonetti GD, et al. (2017) Acute nonspecific mesenteric lymphadenitis: More than "No Need for Surgery". Biomed Res Int 2017: 9784565.
- Lucey BC, Stuhlfaut JW, Soto JA (2005) Mesenteric lymph nodes seen at imaging: Causes and significance. Radiographics 25(2): 351-365.
- Witte CL, Witte MH, Unger EC, Williams WH, Bernas MJ, et al. (2000) Advances in imaging of lymph flow disorders. Radiographics 20(6) :1697-1719.
- Einstein DM, Singer AA, Chilcote WA, Desai RK (1991) Abdominal lymphadenopathy: Spectrum of CT findings. Radiographics 11(3): 457-472.
- Salama AA, Darwish SH, Abdel-Mageed SM, Meshref RA, Mohamed EI, et al. (2021) Deep convolutional neural networks for accurate diagnosis of COVID-19 patients using chest X-ray image databases from Italy, Canada, and the USA. Univ Louisville J Resp Infect 5:34.
- Yang Y, Zheng B, Li Y, Li Y, Ma X (2022) Computer-aided diagnostic models to classify lymph node metastasis and lymphoma involvement in enlarged cervical lymph nodes using PET/CT. Med Phys 50(1):152-162.
- ResNet, AlexNet, VGGNet, Inception (2021) Understanding various architectures of Convolutional Networks.
- Paszke A, Gross S, Massa F, Lerer A, Bradbury J, et al. (2019) PyTorch: An Imperative Style, High-Performance Deep Learning Library. In: Wallach H, Larochelle H, Beygelzimer A, d'Alché-Buc F, Fox E, Garnett R (Eds.), Advances in Neural Information Processing Systems 32, Curran Associates, Inc. 8024-8035.
- Kim I, Rajaraman S, Antani S (2019) Visual interpretation of convolutional neural network predictions in classifying medical image modalities. Diagnostics (Basel) 9(2): 38.
- Castellino RA (2005) Computer aided detection (CAD): an overview. Cancer Imaging 5(1): 17-19.
- Doi K (2007) Computer-aided diagnosis in medical imaging: Historical review, current status and future potential. Comput Med Imaging Graph 31(4-5): 198-211.
- Liu JM, Hua J, Yao JH, White JM, Summers RM (2011) Computer-aided abdominal lymph node detection using contrast-enhanced CT images. In: Summers RM, van Ginneken B, (Eds.) Medical Imaging 2011: computer-aided diagnosis—proceedings of SPIE. Vol. 7963: 796313.
- Ehteshami Bejnordi B, Veta M, Johannes van Diest P, van Ginneken B, et al (2017) Diagnostic assessment of deep learning algorithms for detection of lymph node metastases in women with breast cancer. JAMA 318(22): 2199-2210.
- Rahman MM, Wadud AH, Hasan M (2021) Computerized classification of gastrointestinal polyps using stacking ensemble of convolutional neural network. Informatics in Medicine Unlocked 24: 100603.
- Rasmussen SA, Arnason T, Huang WY (2021) Deep learning for computer-assisted diagnosis of hereditary diffuse gastric cancer. J Pathol Transl Med 55(2): 118-124.
- Liu X, Sun Z, Han C, Cui Y, Huang J, et al. (2021) Development and validation of the 3D U-Net algorithm for segmentation of pelvic lymph nodes on diffusion-weighted images. BMC Med Imaging 21(1): 170.
- Iuga AI, Carolus H, Höink AJ, Brosch T, Klinder T, et al. (2021) Automated detection and segmentation of thoracic lymph nodes from CT using 3D foveal fully convolutional neural networks. BMC Med Imaging 21(1): 69.


 We use cookies to ensure you get the best experience on our website.