Research Article 
![]() Creative Commons, CC-BY
Creative Commons, CC-BY
Poisson Regression Model with Application to Wastewater Surveillance Under a Threshold Linear Mixed Model for COVID-19 Sensitivity Rates
*Corresponding author: Norou Diawara, Department of Mathematics & Statistics, College of Sciences, Old Dominion University Norfolk VA, United States of America
Received: September 15, 2023; Published: September 25, 2023
DOI: 10.34297/AJBSR.2023.20.002683
Abstract
A Threshold Linear Mixed Model (TLMM) has been developed to identify specific thresholds based on wastewater SARS-CoV-2 viral concentrations, which reflect COVID-19 cases. The thresholds can guide decisions regarding public health responses and prevention measures. To assess the practical application of TLMM, a simple simulation was conducted using a sample size of 100 and 500 replications. The simulation allowed for comparing parameter estimators by assessing bias and standard deviation and the root of the mean square error. The model and estimation procedures were applied to reported wastewater and clinic data to test its application for real-world scenarios. Our results demonstrated the efficacy of TLMM in selecting threshold values corresponding to specific levels of wastewater SARS CoV-2 vial concentrations. In particular, TLMM successfully determined threshold values of 0.2 and 0.3, corresponding wastewater SARS-CoV-2 viral concentrations of 2530.1 gene copies/μL and 7,432.6 gene copies/ μL, respectively. These values were indicative of a concerning level of COVID-19 cases. However, threshold values at or above 0.5 were associated with a need for warranted public health responses. TLMM presents a valuable modeling approach for effectively determining critical thresholds for wastewater SARS-CoV-2 viral concentrations, guiding targeted public health actions to address the ongoing pandemic.
Keywords: Linear mixed model, Threshold, COVID-19, Wastewater levels
Introduction
On February 11, 2020, the WHO officially identified SARSCoV- 2, commonly referred to as coronavirus [1]. As of July 28, 2022, the global tally at over 571,198,904 confirmed cases of COVID-19 and over 6,387,863 deaths [2,3]. As the pandemic has evolved, the efforts to manage the COVID-19 pandemic in the communities have shifted from focusing solely on eliminating SARS-CoV-2 transmission. Instead, there is now an emphasis on identifying and utilizing more relevant metrics and tools to prevent and manage the virus (US CDC, 2022).
Wastewater-based surveillance has emerged as a valuable tool for monitoring the presence of COVID-19 cases within communities across many countries (Agrawal, et al., 2021) [4,5]. This approach is crucial in determining testing resource allocation and preventive measures. The rationale for the surveillance lies in its ability to detect SARS-CoV-2 RNA in symptomatic and asymptomatic individuals [6-8]. Also, wastewater-based analysis is more efficient as it reduces the number of tests required to assess a large population. Furthermore, well-established molecular techniques are available for SARS-CoV-2 detection in wastewater, but the research for successful detection of SARS-COV2 in wastewater is ongoing [5,9,10].
The US Centers for Disease Control and Prevention (CDC) launched the National Wastewater Surveillance System in September 2020. This system holds the potential for early detection of COVID-19 outbreaks, often days or weeks ahead of clinical testing methods [11,12]. However, to fully harness its potential, the national coordination and standardized testing, analysis, and practice shall be tailored to the specific needs of individual communities [11], enabling local public health officials to craft community- or city-specific management strategies.
Recent modelling effort has leveraged wastewater surveillance data to forecast COVID-19 cases and trends using various techniques, e.g., the Autoregressive Integrated Moving Average (ARIMA) [13], Neural Network Graphs [14], and Random Forest Method [5]. Our newly developed model, the Gaussian copula marginal regression model, has demonstrated a significant correlation between wastewater SARS-CoV-2 RNA concentrations and COVID-19 cases, allowing for predicting COVID-19 trends [15]. However, this modelling effort may not be directly applied to establish specific thresholds of wastewater SARS-CoV-2 viral concentration for identifying communities or regions where sizeable COVID-19 cases warrant public health response and actions.
In our current study, we have introduced Threshold Linear Mixed Models (TLMMs), an extension of simple linear models, to assess thresholds of wastewater SARS-CoV RNA concentrations, which reflect certain levels of COVID-19 cases calling for public health response. The TLMMs are particularly well-suited for fixed and random effects, and non-independence data as generalized linear models are less appropriate. The temporal dependence of COVID-19 case counts is a notable example. The TLMMS included a simple threshold marginal which can pinpoint the sensitivity level at which longitudinal outcomes, counts, or rates become detected. This innovative approach can potentially select risk tolerance thresholds while considering covariates consistently used to predict COVID-19 cases for the monitoring and management purpose.
Methodology
Wastewater Viral Load Data
The wastewater samples were collected from five pumping stations in Chesapeake VA, from June 2021 to June 2022 [16]. The selection of pumping stations was based on the need for consistency with clinical data and a sufficient sample size for merging clinical cases and wastewater SARS-CoV-2 RNA concentration data. A 1 L grab sample was collected weekly between 8:00 a.m. and 11:00 a.m. at each pumping station. All the samples were then returned to the Hampton Road Sanitation District laboratories, and wastewater SARS CoV-2 RNA concentrations recorded as gene copies/100mL were quantified using the Reverse transcription droplet digital PCR (RT-ddPCR) method [10]. If a SARS-CoV-2 RNA concentration was below the Limit of Detection (LOD) the viral load was calculated based on half of the LOD.
Clinic Data
Clinical data related to the COVID-19 pandemic included dayto- day reported cases of COVID-19. The cases were registered in the statewide database maintained by the Virginia Chesapeake Health Department, which collects information on clinical cases related to COVID-19 infection. The cases occurred in the period of June 2021 to June 2022, consistent with the timeframe of the wastewater sampling and data collection.
Statistical Model and Notation
The model proposed is an extension from the Ge, et al., [16] paper.
A column vector is denoted as  for the longitudinal
measurements of the 𝑖𝑡ℎ pump station with i n observations.
for the longitudinal
measurements of the 𝑖𝑡ℎ pump station with i n observations.
The jth element in yij is the jth observation of pump station i measured at time tij., where ni is the number of observations from the ith pump station, i=1,2,…,N and N is the number of pump stations.
For each pump station,  designed
matrix of covariates for fixed effect β.
designed
matrix of covariates for fixed effect β.
 designed matrix of covariates for
random effect i α.
designed matrix of covariates for
random effect i α.
Substituting in bi, an indicator of the treatment received by pump station i with either bi = 1 if the pump station is detecting a new threshold or bi = 0 if not.
Denote Wi as a continuous covariate, wastewaterSARS-CoV-2
RNA concentration, at the baseline for pump station i and assume
two subgroups of pump stations can be defined based on whether
the wastewater reading N2Concentartion or their transformed values
 exceeds exceeds an unknown threshold
denoted as c . This threshold, often referred to as the cut point or
cut-off point, is a value that we aim to estimate. The threshold c governs the two-part decision steps, which mirrors the hurdle model
cross-sectional: “below-the-threshold” group for no immediate
public health response action vs. “above-the-threshold” group for
warranted public health response action. Within the “above-thethreshold”
group, we further differentiate two subgroups: the lower
and higher risk levels associated with the wastewater SARS-CoV-2
RNA concentrations. This differentiation helps better understand
the degree of risk in this category. The rationale for employing these
thresholds lies in the established link between wastewater SARS
CoV-2 RNA concentrations and the occurrence of COVID-19 cases
[17]. That means wastewater SARS CoV-2 RNA concentrations can
reflect COVID-19 cases within the community. By measuring wastewater
SARS CoV-2 RNA concentration with these thresholds, public
health officials can gain valuable guidance on when and where to
implement targeted public health responses to control the spread
of the disease effectively.
exceeds exceeds an unknown threshold
denoted as c . This threshold, often referred to as the cut point or
cut-off point, is a value that we aim to estimate. The threshold c governs the two-part decision steps, which mirrors the hurdle model
cross-sectional: “below-the-threshold” group for no immediate
public health response action vs. “above-the-threshold” group for
warranted public health response action. Within the “above-thethreshold”
group, we further differentiate two subgroups: the lower
and higher risk levels associated with the wastewater SARS-CoV-2
RNA concentrations. This differentiation helps better understand
the degree of risk in this category. The rationale for employing these
thresholds lies in the established link between wastewater SARS
CoV-2 RNA concentrations and the occurrence of COVID-19 cases
[17]. That means wastewater SARS CoV-2 RNA concentrations can
reflect COVID-19 cases within the community. By measuring wastewater
SARS CoV-2 RNA concentration with these thresholds, public
health officials can gain valuable guidance on when and where to
implement targeted public health responses to control the spread
of the disease effectively.
The following threshold linear mixed model to assess the potential differential cutoff levels and effects between these two subgroups proposed is as follows:

where  is a vector of random errors and 1 is a ni
– dimensional vector with its all elements as 1.
is a vector of random errors and 1 is a ni
– dimensional vector with its all elements as 1.
From Equation (1), the response yij of pump station i measured at the time tij is modelled by three components:
1. the fixed effects of all covariates x β +η I w > c +η b I w > c ,
2. the pump station random effect z'ij αi and
3. the random error εij independent and identically distributed (iid) N (0,σ 2 ).
The columns of i X may include intercept, time or its function, vaccination information, societal behaviours, treatment, and other confounding variables, and we assume that the columns of Zi are a subset of the columns of Xi
In order to simplify the presentation, the model equation (1) is re-written in the matrix form defined as
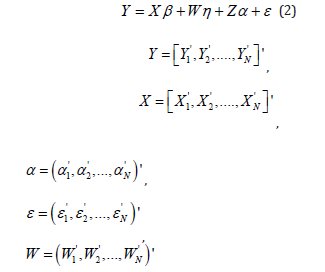


For the vector of random effects α and vector of random errors ε in the model, we assume that E (α ) = 0 and E (ε ) = 0 .
It is also assumed that α and ε are independent and distributed as multivariate normal.
Inferences Via Kernel Smoothing
From the assumptions and notations, Y follows a multivariate
normal distribution. Then, using  as the total number of
observations, and the log-likelihood for the unknown parameters
as the total number of
observations, and the log-likelihood for the unknown parameters
 in equation 2 based on longitudinal outcomes Y
can be written as:
in equation 2 based on longitudinal outcomes Y
can be written as:
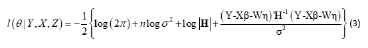
where H is the variance of Y.
As mentioned in Ge, et al., (2020)[16] and Brown and Wang,
et al., (2007) [17], the presence of an indicator function  , in the log-likelihood function is not continuous with respect to
the threshold or cut-off point c; instead of the conventional maximum
likelihood theory and algorithm, the approach is to take a
kernel smooth function as approximation to the indicator variable
, in the log-likelihood function is not continuous with respect to
the threshold or cut-off point c; instead of the conventional maximum
likelihood theory and algorithm, the approach is to take a
kernel smooth function as approximation to the indicator variable
 , defined as:
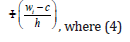
is the distribution function of the standard normal distribution and is a bandwidth.
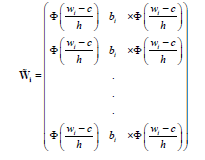
Using the approximation above, we can define a smoothed log-likelihood function by replacing in the definition of in equation 3 with the following:
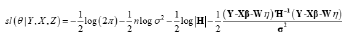
Therefore, the smoothed log-likelihood function of θ is given by
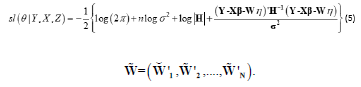
The Maximum Smoothed Likelihood Estimates (MSLE) of θ can be obtained by maximizing the smoothed log-likelihood function from equation (5) or, equivalently, solving the following equations:

Or
The standard errors can be calculated based on the inverse matrix of the Hessian matrix J (â,η,c,ρ 2 ,σ 2 ) after the estimates of θ are obtained. For the selection of the bandwidth, based on the theoretical and empirical evidence presented by Lin, et al., (2011) [18] and He, et al., (2018) [19] we propose to select h = dˆn−1/3 for the proposed estimator, where dˆ is the sample standard deviation of covariate wi.
Simulation Example
To assess the applicability of the TLMM, a simple simulation based on a samples of size n=100 was conducted. The performance of the parameters in the TLMM proposed are being assessed.
The model is written as:

where β0 is the intercept, αi is a random variable for the pump station effect, β1 is the effects of measurement time β2, is the treatment indicator η1 is the subgroup indicator, η2 is the interaction between the treatment and subgroup indicators, and εij is the random error, as described in equation (1).
In the simulation study done for this paper, we assume that pump stations are randomly assigned to either treatment group bi =1 or control group bi =0 , each with probability 1/2 and each pump station is measured at the same four equal spaced timepoints 1, 2, 3, and 4. For each pump station i, the baseline covariate wi and random effect αi are generated, respectively, from a uniform distribution [0,1]; and a normal distribution with mean zero and covariance σ 2 , while the random error εij is generated from a normal distribution with mean zero and covariance σ 2 = 2.25 =1.52 . The coefficients of fixed effects in the model are taken as, β0 =1, β1 =5 , β2 =2, η1=4.9, η2=3 while the true cut-point of i w for the definition of subgroup is c = 0.3. In each scenario, 500 replications are used to obtain the bias, Standard Deviation (SD), and the Root of the Mean Square Error (RMSE) of the parameter estimators under bootstrap. Table 1 describes the parameters derived from the simulated LMM example.

Table 1: Demographic Characteristics in Baseline.
IG: intervention group; CG: control group
From Table 1, we can see that the bias and RMSE of the estimates for all parameters, except the biases of estimates for σ 2 and q2 , decrease as the total number of observations increases when h is fixed at the optimal value and RMSE becomes very small for most of parameters This value of h is very close to that calculated from the optimal bandwidth formula.
We also compared the empirical standard deviations of the parameter estimates with the averages of the estimated standard errors based on the inverse of the Hessian matrix (Table 1).
From the Table 1, the generated values for β0, β1, β2, η1, η2 and c do converge even if they share different characteristics and spreads. To gain more insight, we plot the histograms. The histograms show the convergent value(s) of the parameter. The target solution is consequently obtained and close to the optimal values. The change in the c value, from the initial 0.7 to 0.56, indicates that there is a reliable estimate for the threshold. Out of the 100 observations, when 43 data points are found under the threshold data limit of c=0.3, the new estimation method finds 85 of them under the threshold 0.56 (Figure 1).
The plot of the simulated transformed Y values contrasted with the threshold c is described in Figure 1. The gap in the threshold (true vs estimated) values are quite large, but the simulation could gain a lot by considering starting parameter for c closer to 0.3.

Figure 1: Plot of the simulated data example contrasted with threshold c.
Application to Wastewater and Clinic Data
We applied the proposed model and estimation procedures
to the wastewater and clinic data. The model assesses the performance
of the proposed cutoff and threshold estimators. The response
variable y follows a Poisson and is described as:  ,
for i=1,..,43, using data from the 43 time points. The various threshold
values considered are: c=0.1,0.3,0.5,0.7 and 0.9, corresponding
to the values of wastewater viral load concentrations of 2530.1,
7432.6, 12335.0, 17237.4, 22139.9 gene copies/μL, respectively.
In the clinic data, y represents the number of COVID-19 cases, 1 x
represents the hospitalization cases, 2 x represents the death cases,
3 x represents the wastewater SARS-CoV concentration, and 4 x
represents the interaction between hospitalization cases and the
wastewater SARS-CoV concentration. The methodology from Section
2 is applied on each threshold value, and the ranges of observations
captured across the COVID-19 case plots were compared.
,
for i=1,..,43, using data from the 43 time points. The various threshold
values considered are: c=0.1,0.3,0.5,0.7 and 0.9, corresponding
to the values of wastewater viral load concentrations of 2530.1,
7432.6, 12335.0, 17237.4, 22139.9 gene copies/μL, respectively.
In the clinic data, y represents the number of COVID-19 cases, 1 x
represents the hospitalization cases, 2 x represents the death cases,
3 x represents the wastewater SARS-CoV concentration, and 4 x
represents the interaction between hospitalization cases and the
wastewater SARS-CoV concentration. The methodology from Section
2 is applied on each threshold value, and the ranges of observations
captured across the COVID-19 case plots were compared.
We display the cutoff structures in Figure 2. The accuracy and measure of uncertainty of the parameters are plotted via their kernel density estimators in Figure 3. By providing multiple ranges, different tailored decisions may be called for, e.g., no public health response action or warranted public health response action. Values of wastewater readings were deemed to be acceptable, or they could be found to be above tolerance level, requiring further exploration.
The coefficients of fixed effects in the model were estimated, with the different cut points of c. Replications were done for 10,000 bootstrap processes to obtain the bias, SD, RMSE, of the parameter estimators.
The fitted lines resulting from the TLMM at different cutoff values are shown in Figure 2. For any cutoff value between 0.2 (2530.1) and 0.3 (7432.6), the scale of the COVID-19 cases is not alarming. Wastewater SARS-CoV-2 RNA concentrations at the thresholds greater than 0.5 (12335.0) indicate increased COVID-19 cases warranted public health response.

Figure 2: Fitted lines resulting from the projected threshold values with respect to the 100th COVID-19 cases.
Discussion and Conclusions
A threshold linear mixed model based on Poisson regression has been introduced and designed for the identification of subsets of public health responses based on longitudinal COVID-19 cases and wastewater SARS COV-2 RNA concentrations. This model can include time-dependent effects and both fixed and random effects from covariates in the analysis. To estimate the unknown parameters within this model, statistical procedures are constructed based on a smooth approximation of an indicator function. Efficient computational algorithms are developed to compute the estimators and associated variances. The effectiveness of this proposed approach has been assessed through simulation studies, where its performance was evaluated using SD and RMSE. The results from these simulations indicate that the proposed procedures perform adequately. Furthermore, when applied to the analysis of clinical and environmental data, our modeling procedures have demonstrated practicality and stability. This suggests that the modeling can be effectively employed in real-world scenarios.
The main objective of conducting the threshold linear mixed model was to simultaneously determine the cut point of the wastewater SARS CoV-2 vial concentrations that reflect the levels of the COVID-19 cases calling for public health responses. We therefore propose a smoothing likelihood function to approximate the original likelihood function from the wastewater and clinic data and to make inferences on the model parameters based on the new likelihood function given. The proposed model is quite robust to determine the thresholds based on wastewater SARS-CoV-2 viral concentrations. To truly reflect current scenarios of the levels of COVID-19 cases, the model requires constant updates by ongoing monitoring of wastewater SARS CoV-2 viral concentrations.
The use of wastewater SARS CoV-2 viral concentration to establish thresholds is an innovative approach. Beyond the inherent benefits of wastewater surveillance, the analysis of SRAS-CoV-2 viral concentration in wastewater, coupled with the advanced modelling effort, could provide invaluable data for timely decisions and implementing practical actions and prevention measures at the community level. The study confirmed that there is a relationship between wastewater SARS-CoV-2 viral concentrations and COVID-19 cases. In essence, the use of wastewater SARS-CoV-2 viral concentration as a tool for threshold determination creates new avenues for effective public health responses, providing a balance readiness and early warming settings [20-24].
This research has several limitations, including the privacy of data, political decisions, and economic effects associated with coordinated public health responses based on wastewater surveillance data in general. Additionally, while the proposed procedure has undergone evaluation through simulation studies and an application to both wastewater and clinic data, the goodness of fit of threshold estimates may vary from one community to another. Consequently, the results cannot be extrapolated over a large geographic area, such as an entire or state. This makes the strategy of disease surveillance locally focused. To address this limitation, it is recommended to consider implementing statewide wastewater surveillance. Such an approach would help address the inherent variability in threshold estimates across different communities [25-28].
Acknowledgment
We acknowledge the staff and laboratory technicians from the Hampton Roads Sanitation District for wastewater sampling and SARS CoV-2 analysis. Also, we thank the staff from the Chesapeake Health Department for participating in data interpretation.
Conflict of Interest
None.
References
- https://www.who.int/emergencies/diseases/novel-coronavirus-2019?
- https://www.vdh.virginia.gov/coronavirus/see-the-numbers/covid-19-in-virginia/
- https://covid19.who.int/
- https://covid.cdc.gov/covid-data-tracker/#datatracker-home
- Gonzalez R, Curtis K, Bivins A, Bibby K, Weir MH, et al. (2020) COVID-19 surveillance in Southeastern Virginia using wastewater-based epidemiology. Water Res 186: 116296.
- Parasa Sravanthi, Nageshwar Reddy, Douglas O Faigel, Alessandro Repici, Fabian Emura, et al. (2020) Global impact of the COVID-19 pandemic on endoscopy: an international survey of 252 centers from 55 countries. Gastroenterology 159(4): 1579-1581.
- Peccia Jordan, Alessandro Zulli, Doug E Brackney, Nathan D Grubaugh, Edward H Kaplan, et al. (2020) SARS-CoV-2 RNA concentrations in primary municipal sewage sludge as a leading indicator of COVID-19 outbreak dynamics. MedRxiv 2020-05.
- Tang Yi Wei, Jonathan E Schmitz, David H Persing, Charles W Stratton (2020) Laboratory diagnosis of COVID-19: current issues and challenges. J Clin Microbiol 58(6): e00512-e00520.
- Shah S, Gwee SXW, Ng JQX, Lau N, Koh J, et al. (2022) Wastewater surveillance to infer COVID-19 transmission: A systematic review. Sci Total Environ 804: 150060.
- Bogler A, Packman A, Furman A, Amit Gross, Ariel Kushmaro, et al. (2020) Rethinking wastewater risks and monitoring in light of the COVID-19 pandemic. Nat Sustain 3: 981-990.
- CDC (2022) Overview and Scientific Rationale. Indicators for Monitoring COVID-19 Community Levels and COVID-19 and Implementing COVID-19 Prevention Strategies.
- (2022) WHO estimates nearly 15 million excess deaths during pandemic, Significance 3.
- Dansana D, Kumar R, Das Adhikari J, Mohapatra M, Sharma R, et al. (2020) Global forecasting confirmed and fatal cases of COVID-19 outbreak using autoregressive integrated moving average model. Front Public Health 8: 580327.
- Kapoor Amol, Xue Ben, Luyang Liu, Bryan Perozzi, Matt Barnes, et al. (2020) Examining covid-19 forecasting using spatio-temporal graph neural networks. arXiv preprint arXiv:2007.03113.
- Yeşilkanat Cafer Mert (2020) Spatio-temporal estimation of the daily cases of COVID-19 in worldwide using random forest machine learning algorithm. Chaos Solitons Fractals 140: 110210.
- Jeng HA, R Singh, N Diawara, K Curtis, R Gonzalez, et al. (2023) Application of wastewater-based surveillance and copula time-series model for COVID-19 forecasts. Sci Total Environ 885: 163655.
- Ge X, Peng Y, Tu D (2020) A threshold linear mixed model for identification of treatment-sensitive subsets in a clinical trial based on longitudinal outcomes and a continuous covariate. Stat Methods Med Res 29(10): 2919-2931.
- Brown B, Wang YG 2007 Induced smoothing for rank regression with censored survival times. Stat Med 26(4): 828-836.
- Lin H, Zhou L, Peng H, Xiao Hua (2011) selection and combination of biomarkers using ROC method for disease classification and prediction. Can J Stat 39: 324-343.
- He Y, Lin H and Tu D (2018) A single-index threshold Cox proportional hazard model for identifying a treatment-sensitive subset based on multiple biomarkers. Stat Med 37(23): 3267-3279.
- Hasan SW, Y Ibrahima, M Daou, H Kannout, N Jan, et al. (2021) Detection and quantification of SARS-CoV-2 RNA in wastewater and treated effluents: Surveillance of COVID-19 epidemic in the United Arab Emirates. Sci Total Environ 764: 142929.
- Broyden CG 1970 The convergence of a class of double-rank minimization algorithms 1. General considerations. IMA J ApplMath 6(1): 76-90.
- (2022) WHO estimates nearly 15 million excess deaths during pandemic Significance. 3.
- https://stats.oarc.ucla.edu/other/mult-pkg/introduction-to-linear-mixed-models/
- https://www.vdh.virginia.gov/environmental-health/wastewater-surveillance-for-covid-19/]
- Fletcher R (1970) A new approach to variable metric algorithms. Comput J 13: 317-322.
- Goldfarb D (1970) A family of variable-metric methods derived by variational means. Math Comput 24(109): 23-26.
- Shanno DF (1970) Conditioning of quasi-newton methods for function minimization. Math Comput 24: 647-656.


 We use cookies to ensure you get the best experience on our website.