Review Article 
 Creative Commons, CC-BY
Cardiovascular Disease Prediction Using Machine Learning
*Corresponding author: Wisam Bukaita, Lawrence Technological University, USA.
Received: May 21, 2025; Published: May 29, 2025
DOI: 10.34297/AJBSR.2025.27.003539
Abstract
Cardiovascular Diseases (CVDs) remain among the leading causes of death worldwide, highlighting the urgent need for tools that can support early diagnosis and intervention. This research explores the use of supervised machine learning techniques to predict cardiovascular risk using commonly available clinical and demographic data. The goal of this research is to develop accurate, interpretable models that help the clinical department identify individuals at risk and improve decision-making in preventive cardiology. The research focuses on three widely used algorithms: Random Forest, XGBoost, and Support Vector Machine (SVM). The dataset used contains 14 key attributes collected from patient health records CDC (CDC: Centers for Disease Control and Prevention), including main factors age, gender, blood pressure, cholesterol levels, chest pain type, and maximum heart rate. A thorough data preprocessing pipeline is applied prior to model training. This includes handling missing values with imputation, removing duplicates, detecting. These steps help ensure clean, consistent input for the models. Results demonstrate that Random Forest outperformed the other models, achieving an accuracy of 84%, ROC-AUC score of 92%, precision 84%, F1-Score 84% and recall/sensitivity of 84%. XGBoost exhibited comparable performance with slightly higher precision of 86%, accuracy of 82%, recall/sensitivity of 78%, F1-score of 82% and ROC-AUC of 91%, while Support Vector Machine (SVM) showed promise with accuracy of 70%, precision of 67%, F1-Score of 76%, sensitivity/recall 88% and ROC-AUC 84% but is sensitive to feature scaling and lacked robustness in handling non-linear patterns in the data. The models are further tested on hypothetical patient profiles to assess their ability to detect less obvious patterns in the data. These results reinforce the potential of ensemble machine learning methods to support early risk detection and assist clinicians in identifying high-risk patients. With proper integration, such models can serve as valuable tools in real-world healthcare settings.
Keywords: Cardiovascular risk prediction, Supervised machine learning, Random forest and XGBoost, Preventive cardiology
Introduction
Cardiovascular Diseases (CVDs) constitute a significant global health burden, accounting for approximately 17.9 million annual deaths, as reported by the World Health Organization (WHO). These diseases encompass a wide spectrum of heart and vascular conditions, such as coronary artery disease, heart failure, and arrhythmias. Despite advancements in medical diagnostics, the early detection of CVDs remains a critical challenge, as tradition al diagnostic methods often rely on invasive testing and subjective clinical interpretations. This underscores the urgency of developing more efficient, non-invasive, and reliable methods to predict cardiovascular risk at an earlier stage. Machine Learning (ML), a subfield of artificial intelligence, has emerged as a transformative tool in healthcare, offering innovative approaches for predictive modeling and personalized medicine. ML algorithms excel in analysing large datasets and identifying complex patterns that may elude traditional statistical methods. By leveraging ML, it is possible to predict the presence of CVDs with improved precision, enabling timely interventions and reducing the likelihood of adverse outcomes. This study utilizes a dataset comprising 14 clinical and demographic variables such as age, gender, Chest Pain Type (cp), Cholesterol Level (chol), Resting Blood Pressure (trestbps), Fasting Blood Sugar(fbs), Resting Electrocardiographic Results(restecg), Maximum Heart Rate (thalach), Exercise-Induced Angina (exang), ST depression induced by exercise(oldpeak), slope of the peak exercise ST segment(slope), Number of major vessels(ca), thalassemia( thal), and target variable indicating the presence or absence of Cardiovascular Disease(CVD). These attributes represent significant risk factors and clinical markers associated with cardiovascular health. The primary objective of this research is to evaluate the predictive capabilities of three widely used machine learning models Random Forest, XGBoost, and Support Vector Machine (SVM) in accurately classifying individuals as CVD-positive or CVD-negative.
Unlike previous studies that often rely on default model configurations, this research emphasizes multiple models and their comparison to optimize model performance. Additionally, it prioritizes metrics that are critical in healthcare settings, such as sensitivity (recall), to minimize false negatives cases where individuals with CVD might be incorrectly classified as healthy. Comparative analysis of the models is conducted using metrics such as accuracy, precision, F1-score, and AUC-ROC, ensuring a comprehensive evaluation of their effectiveness. Furthermore, the study extends beyond theoretical analysis by testing the models on unseen patient data to assess their real-world applicability. By focusing on both model optimization and practical deployment, this research aims to bridge the gap between academic study and clinical implementation. This research contributes to the growing body of literature on CVD prediction by employing a comprehensive set of clinical features for model training and evaluation. Demonstrating the practical utility of predictive models in real-world diagnostic scenarios. The findings presented in this study have the potential to enhance early detection strategies for cardiovascular diseases, ultimately improving patient outcomes and reducing the global burden of CVDs.
Literature Review
In Deo (2015) [1] highlighted that despite the availability of large medical datasets and learning algorithms, machine learning has had limited clinical impact due to challenges in implementation and integration into healthcare systems. Meanwhile Obermeyer and Emanuel (2016) [2] discussed the future potential of big data and machine learning in clinical medicine, emphasizing that while predictive models show promise, their real-world success depends on effective integration into clinical workflows. And in 2017 Weng [3] applied supervised machine learning models such as random forests and logistic regression to routine clinical data and found that these models significantly outperformed traditional cardiovascular risk prediction tools in accuracy and calibration. Meanwhile in 2018 Johnson [4] reviewed the landscape of artificial intelligence in cardiology, focusing on how deep learning, neural networks, and data fusion can enhance diagnostic accuracy, treatment personalization, and workflow optimization. They concluded that AI holds transformative potential in cardiovascular care through data-driven decision-making. In a study published by (Alotalibi, et al, 2019), the author aimed to investigate the utility of Machine Learning (ML) techniques for predicting heart failure disease. The study utilized a dataset from the Cleveland Clinic Foundation, and implemented various ML algorithms, such as decision tree, logistic regression, random forest, naive Bayes, and Support Vector Machine (SVM), to develop prediction models. A 10-fold cross-validation approach is employed during the model development process. The results indicated that the decision tree algorithm achieved the highest accuracy in predicting heart disease, with a rate of 93.19%, followed by the SVM algorithm at 92.30%. This study provides insight into the potential of ML techniques as an effective tool for predicting heart failure disease and highlights the decision tree algorithm as a potential option for future research. Whereas Mohan [5] presented a hybrid approach integrating SVM, KNN, and ensemble classifiers for heart disease prediction, achieving over 90% accuracy and robustness across multiple datasets.
In a study conducted by Shah [6], the authors aimed to develop a model for predicting cardiovascular disease using machine learning techniques. The data used for this purpose is obtained from the Cleveland heart disease dataset, which consisted of 303 instances and 17 attributes, and are sourced from the UCI machine learning repository. The authors employed a variety of supervised classification methods, including naive Bayes, decision tree, random forest, and K-Nearest Neighbor (KKN). The results of the study indicated that the KKN model exhibited the highest level of accuracy, at 90.8%. The study highlights the potential utility of machine learning techniques in predicting cardiovascular disease and emphasizes the importance of selecting appropriate models and techniques to achieve optimal results. And Krittanawong [7] reviewed artificial intelligence methods including deep learning and neural networks, concluding that such technologies hold strong potential for enabling precision cardiovascular medicine and individualized treatment plans. In 2020 Guo [8] analyzed AI publications to understand the dynamic and longitudinal bibliometric analysis of health care. The major health problems studied in AI research are cancer, depression, Alzheimer disease, heart failure, and diabetes. Artificial neural networks, support vector machines, and convolutional neural networks have the highest impact on health care. This research provides a comprehensive overview of the AI-related research conducted in the field of health care, which helps researchers, policy makers, and practitioners better understand the development of health care-related AI research and possible practice implications and Abdeldjouad [9] proposed a hybrid diagnostic model combining decision trees and SVM for heart disease prediction. Using healthcare datasets, they achieved improved diagnostic precision and reliability over traditional standalone models. Chicco and Jurman [10] demonstrated that using only two features serum creatinine and ejection fraction machine learning models like logistic regression and SVM could accurately predict heart failure survival. In 2021 Ji [11] used wearable device based mobile health as an early screening and real-time monitoring tool to address this balance and facilitate remote monitoring to help improve the efficiency and effectiveness of acute CVD patient management while reducing infection risk. Building on that Kishor and Jeberson (2021) [12] explored heart disease diagnosis using IoT-based sensing and machine learning models like Random Forest and Decision Trees. Their framework achieved high accuracy in remote monitoring and early detection. Hassan [13] aimed to predict coronary heart disease using various machine learning classifiers, including Support Vector Machines (SVM), Decision Trees, and Logistic Regression. Their model, trained on the UCI dataset, achieved high classification accuracy, supporting ML’s effectiveness in CHD prediction. Meanwhile Gour [14] developed a machine learning framework for predicting heart attacks using models such as Naïve Bayes, Random Forest, and Logistic Regression. Their system demonstrated improved accuracy and helped identify key risk features from patient datasets.
Subahi [15] introduced a modified self-adaptive Bayesian algorithm within an Internet of Things (IoT) system for smart heart disease prediction. Their system enabled real-time, efficient, and accurate diagnosis in IoT healthcare environments. Whereas Abdalrada [16] utilized machine learning to predict the co-occurrence of diabetes and cardiovascular disease. Through a retrospective cohort study, their models uncovered critical comorbidity patterns, supporting preventive health strategies. And Truong [17] applied ML techniques to fetal echocardiography for early screening of congenital heart disease. Their models achieved high sensitivity and specificity, improving prenatal diagnosis accuracy. In 2023 Saeedbakhsh [18] performed research on Coronary Artery Disease (CAD) which is known as the most common cardiovascular disease. The aim of this study is to detect CAD using machine learning algorithms. In this study, three data mining algorithms Support Vector Machine (SVM), Artificial Neural Network (ANN), and random forest are used to predict CAD using the Isfahan Cohort Study dataset of Isfahan Cardiovascular Research Center. 19 features with 11495 records from this dataset are used for this research. All three algorithms achieved relatively close results. However, the Support Vector Machine (SVM) had the highest accuracy compared to the other techniques. The accuracy is calculated as 89.73% for Support Vector Machine (SVM). The Artificial Neural Network (ANN) algorithm also obtained the high area under the curve, sensitivity and accuracy and provided acceptable performance. Age, gender, Sleep satisfaction, history of stroke, history of palpitations, and history of heart disease are most correlated with target class. Eleven rules are also extracted from this dataset with high confidence and support. In this study, it is shown that machine learning algorithms can be used with high accuracy to detect Coronary Artery Disease (CAD). Thus, physicians can perform timely preventive treatment in patients with CAD. Building on this in 2023 Baghdadi [19] employed ensemble learning techniques on real-world cardiovascular patient data and achieved high accuracy in early detection and diagnosis, demonstrating the effectiveness of advanced machine learning approaches.
In 2024 Vyshnya [20] analysed to develop a clinical decision support tool that can predict Cardiovascular Disease (CVD) risk with high accuracy while requiring minimal clinical feature input. In this study, they proposed a robust feature selection approach that identifies five key features strongly associated with CVD risk, which have been found to be consistent across various models. The machine learning model developed using this optimized feature set achieved state-of-the-art results, with an AUROC of 91.30%, sensitivity of 89.01%, and specificity of 85.39%. Furthermore, the insights obtained from explainable artificial intelligence techniques enable medical practitioners to offer personalized interventions by prioritizing patient-specific high-risk factors. Their work illustrates a robust approach to patient risk prediction which minimizes clinical feature requirements while also generating patient-specific insights to facilitate shared decision-making between clinicians and patients. In 2019, Saqlain [21] developed a heart disease diagnostic system using feature subset selection to enhance classification performance. Three algorithms -mean Fisher score-based, forward, and reverse selection -were used to identify optimal features, which were then classified using an SVM with an RBF kernel. Validated on four UCI datasets (Cleveland, Hungary, Switzerland, SPECTF), the model achieved accuracies ranging from 81.19% to 92.68%. In 2023, Bhatt [22] proposed a cardiovascular disease prediction model using k-modes clustering with Huang initialization and machine learning classifiers (DT, RF, MP, XGB). Trained on a 70,000-instance Kaggle dataset, the models were optimized via Grid Search CV. The Multilayer Perceptron with cross-validation achieved the highest accuracy of 87.28%, with AUC values of 0.94-0.95 across models, demonstrating strong predictive performance.
Dataset Description
The dataset used in this study contains real-world clinical data collected from patients undergoing cardiovascular examinations CDC. It consists of 14 features that include a combination of demographic, clinical, and diagnostic indicators commonly associated with cardiovascular health. These features include age, gender, resting blood pressure, serum cholesterol, fasting blood sugar, chest pain type, resting electrocardiographic results, maximum heart rate achieved, exercise-induced angina, ST depression, the slope of the peak exercise ST segment, number of major vessels colored by fluoroscopy, thalassemia status, and a target variable indicating the presence or absence of cardiovascular disease. Each entry in the dataset represents a single patient profile, and the dataset is structured such that the target variable is binary labeled as 1 for patients with a diagnosed cardiovascular condition and 0 for those without. This setup is ideal for binary classification using supervised machine learning. The original dataset underwent an initial review to identify missing values, duplicates, and potential inconsistencies. All values are either numerical or categorical, with no free-text entries, making it well-suited for preprocessing and modeling. The balanced representation of both healthy and affected individuals in the target variable supports fair training and evaluation across models.
Sample Preview of the Dataset
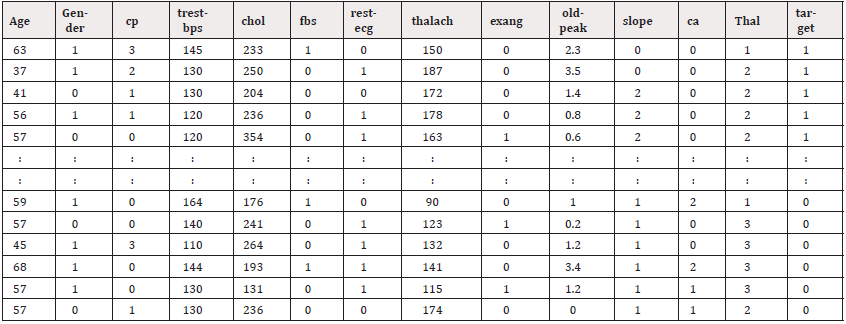
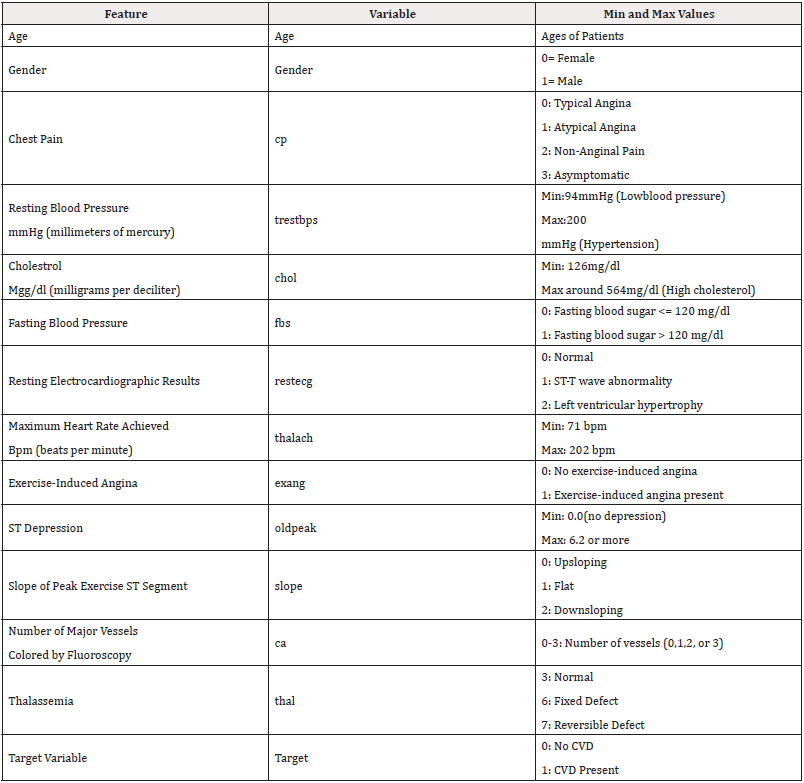
To understand the structure of the dataset, a quick preview helps highlight how the patient records are organized. Each row represents a single individual, with various columns capturing their clinical measurements and diagnostic indicators. Table 1 shows the first and last five rows of the dataset and Table 2 shows all the 14 dataset attributes features and helps confirm that the dataset is formatted properly before applying any preprocessing or model training.
Methodology
This methodology outlines the step-by-step approach followed for the analysis, training, evaluation, and comparison of machine learning models to solve the given problem. The data preprocessing phase ensures that the dataset is in its optimal form for training and evaluating machine learning models. Since the dataset contains no missing values, outliers, or unencoded categorical variables, the focus is on preparing the data to enhance model performance. The dataset is loaded into a Pandas Data Frame, and its structure is inspected using summary statistics and Exploratory Data Analysis (EDA). Anomalies or inconsistencies are not observed during this inspection.
As the dataset does not require handling of missing values or encoding of categorical variables, feature scaling is applied to standardize the numerical features. Standard scaling (z-score normalization) is utilized to ensure that all features contribute equally during the training process, particularly for algorithms sensitive to feature magnitudes, such as Support Vector Machines (SVM). Feature selection is performed to reduce dimensionality and enhance model interpretability and efficiency. This process involves analyzing a correlation matrix to identify and remove highly correlated features, implementing Recursive Feature Elimination (RFE) with a baseline model to rank feature importance, and utilizing tree-based feature importance methods (e.g., Random Forest and XGBoost) to exclude redundant or irrelevant features. The dataset is then split into training and testing subsets using an 80-20 stratified split. Stratified sampling ensures that the class distribution of the target variable is preserved in both subsets, enabling better generalization during model evaluation. Finally, the pre-processed dataset is validated to confirm readiness for modeling. All features are appropriately scaled, the target variable’s distribution is verified, and the selected features are confirmed to be relevant. This preprocessing pipeline provides a robust foundation for model training and evaluation.
Feature Visualization and Distribution Analysis
Before proceeding to model development, the cleaned dataset is explored visually to understand the relationships between features and detect potential outliers using correlation heatmap, boxplot of features. These insights provide foundational knowledge of how each variable may contribute to the prediction task.
Correlation Heatmap of Clinical Features
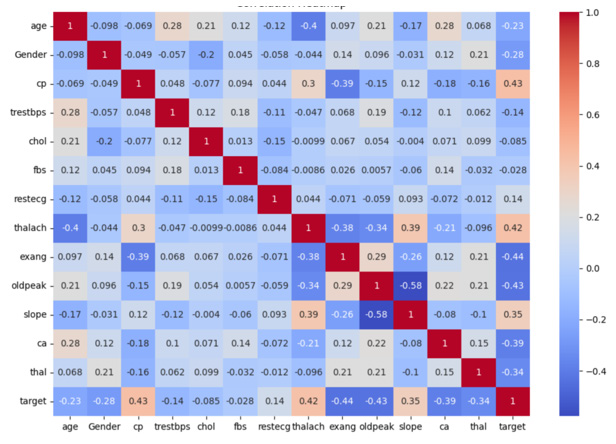
To identify potential relationships among numerical features, a correlation heatmap is generated. This plot highlights how strongly one feature varies in relation to another, which is crucial in understanding multicollinearity or identifying key predictors. Understanding the relationships between different clinical variables is crucial before model training. A correlation heatmap serves as a powerful visual tool to identify how strongly features are associated with each other and with the target variable. High correlations might indicate redundancy, while moderate correlations can guide feature selection and engineering.
In the Figure 1 below, a correlation matrix is constructed using Pearson’s correlation coefficients across all numerical variables in the dataset. Warmer colors (red) indicate strong positive correlations, while cooler shades (blue) reflect negative relationships. This visualization helps identify trends such as the inverse relationship between maximum heart rate (thalach) and age, or the positive correlation between Chest Pain type (cp) and the target variable, which denotes cardiovascular risk. Such insights are valuable in understanding data behavior, especially for selecting influential predictors and mitigating issues like multicollinearity during model development.
Boxplot Visualization
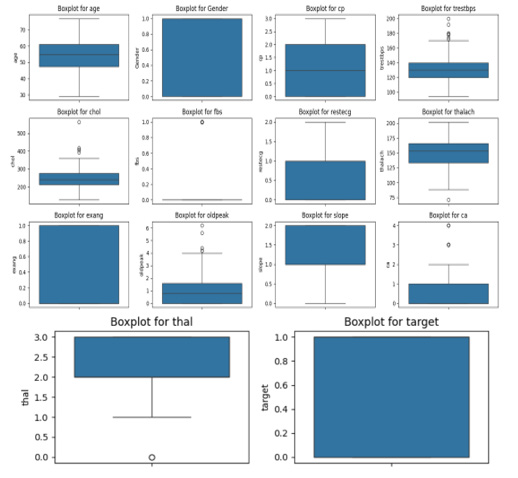
A boxplot visualization is also used to inspect the spread of continuous features and detect any remaining outliers post-cleaning. To understand the distribution and detect any remaining anomalies in the numerical data after preprocessing, a boxplot is generated for all continuous variables. This visualization helps in identifying the central tendency, spread, and presence of outliers across unique features. Boxplots, also known as whisker plots, are crucial tools in exploratory data analysis to visualize the distribution, spread, and potential outliers in a dataset. They summarize a dataset using five key statistical metrics: minimum, first Quartile (Q1), median, third Quartile (Q3), and maximum. The central line inside the box represents the median, while the edges of the box indicate Q1 and Q3, capturing the Interquartile Range (IQR), which is the middle 50% of the data. Whiskers extend to the smallest and largest values within 1.5 times the IQR from Q1 and Q3, respectively, and any points outside this range are plotted as outliers. Figure 2, the boxplots illustrate the distributions of various features in the dataset. Features such as age, chol, and trestbps show a relatively consistent distribution with some outliers, while features like thalach and oldpeak highlight potential anomalies that may require further investigation. Binary features like fbs, exang, and target exhibit distinct categorical behavior, as indicated by their discrete values. The thal and target provide further insights. The thal feature demonstrates a clear range with one apparent outlier, while the target feature, being binary, shows distinct categorical values of 0 and 1. Together, these visualizations enable a deeper understanding of the dataset’s structure, variability, and the presence of any anomalies that may influence subsequent modeling efforts.
Model Evaluation Methods
The Cardiovascular Disease (CVD) dataset is split into training
and testing in an 80 % and 20 % ratio. The performance of the two
experiments is compared. The classification evaluation metrics
used are accuracy, precision, Recall, F1 score and area under the
ROC curve. The accuracy explains the overall model performance. It
explains the percentage of the accurate predictions the model made
to the total predicted class expressed as Accuracy 
Precision measures how suitable or precise is the model when
it identifies a person with cardiovascular problem, mathematically
expressed as Precision 

While specificity measures those who are correctly identified as not having the CVD problem; the sensitivity/recall and specificity aims to reduce False Negatives (FN) and False Positives (FP) respectively. F1_Score is the harmonic mean of precision and recall. The increase of F1_Score is proportional to the increase of precision and recall hence better the model performance. F1_Score performs better even when class distribution is imbalanced, and the values of the false positives and false negatives are different, F1-Score is appropriate. The mathematical expression of F1_score is

The area under the Receiver Operating Characteristic (AUCROC)
curve is also used to measure the performance of the two
experiments. The AUC-ROC shows the ability of an algorithm to
classify those with CVD and those without CVD or positive and
negative classes. It is a graphical tool that plots sensitivity (true
positive rate) against specificity (false positive rate) for various
classification threshold values. The True Positive Rate (TPR) is expressed
as  and False Positive Rate (FPR) is expressed as
 .The more the curve expands to a coordinate (0,1) on x,
y plane of the ROC area indicates the few false negatives and positives
that indicate the model accuracy Table 3.
Model Implementation
In this study, three supervised classification models are implemented to predict the likelihood of cardiovascular disease based on patient features: Support Vector Machine, Random Forest, and XGBoost. Each model represents a different approach to classification, offering a balance between interpretability, performance, and complexity.
Support Vector Machine (SVM)
Support Vector Machine (SVM) is a powerful supervised machine learning algorithm widely used for classification and regression tasks. It works by identifying the optimal hyperplane that separates data points of different classes in a feature space. The algorithm maximizes the margin, which is the distance between the hyperplane and the nearest data points from each class, known as support vectors. These support vectors are crucial as they directly influence the position and orientation of the hyperplane. For linearly separable data, SVM finds a straight hyperplane, while for non-linear data, it employs the kernel trick to map the data into a higher-dimensional space where linear separation is possible. Common kernel functions include linear, polynomial, Radial Basis Function (RBF), and sigmoid. SVM can handle both hard margins, where no misclassification is allowed, and soft margins, where some flexibility is introduced to manage noisy or overlapping data. Its ability to work effectively in high-dimensional spaces and its robustness against overfitting make SVM a popular choice in applications like image recognition, text classification, and bioinformatics. However, it may require careful tuning of hyperparameters and kernel selection, and its computational cost can be high for large datasets.
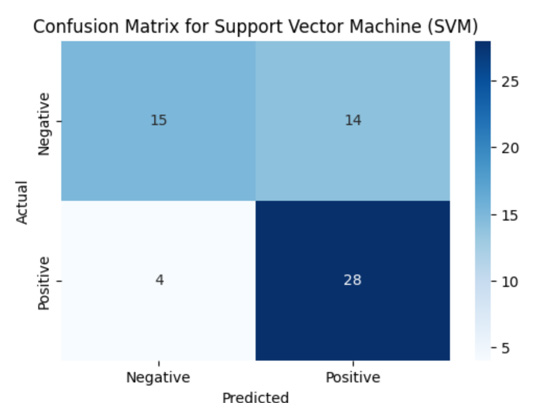
Confusion Matrix - Support Vector Machine (SVM)
The confusion matrix Figure 3 illustrates the model’s prediction performance by showing the number of true positives, true negatives, false positives, and false negatives.
The model achieves an accuracy of 70%, precision 67%, recall/ sensitivity of 88% and ROC-AUC of 84%. It correctly classifies most of the cases but misclassifies 18 out of 61, showing room for improvement through more advanced ensemble methods.
Random Forest
Random Forest is an ensemble-based algorithm that builds multiple decision trees and merges their results to improve accuracy and reduce overfitting. It uses bagging (bootstrap aggregation) and random feature selection to ensure diversity among trees, which enhances generalization on unseen data. This model achieved an accuracy of 84%. It is trained using the same processed dataset. During training, the number of trees (n_estimators) and other hyperparameters can be adjusted for better results. Random Forest tends to perform well on complex, non-linear datasets and provides built-in feature importance scores that help explain predictions. To improve upon the baseline performance of logistic regression, a Random Forest classifier is used due to its robustness and ability to capture complex interactions between features. Random Forest is an ensemble learning technique that builds multiple decision trees and merges their predictions to enhance accuracy and control overfitting. It is particularly well-suited for datasets that include both categorical and numerical variables. In this case, the model is initialized with 100 decision trees (n_estimators=100) and trained on the scaled training data. The performance is then evaluated using accuracy and classification metrics. A confusion matrix is also plotted to visualize the classification results for both cardiovascular and non-cardiovascular cases. The model demonstrates a noticeable improvement in predictive power compared to the logistic regression approach.
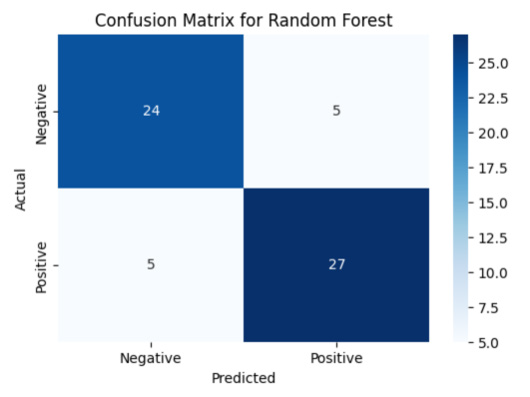
The confusion matrix for the Random Forest model illustrates the prediction accuracy across both classes patients with and without cardiovascular disease. Out of 61 total test samples: 1. 24 individuals without CVD are correctly predicted (True Negatives)
2. 5 individuals without CVD are incorrectly predicted as having CVD (False Positives)
3. 27 individuals with CVD are correctly predicted (True Positives)
4. 5 individuals with CVD are incorrectly predicted as not having CVD (False Negatives)
This leads to a total of 8 misclassifications, which is an improvement compared to logistic regression (which had 11). The model achieves an overall accuracy of 84%. The classifier also maintains a balanced precision of 84% and f1-score of 84%, indicating robust performance in identifying both healthy and at-risk patients Figure 4.
XGBoost
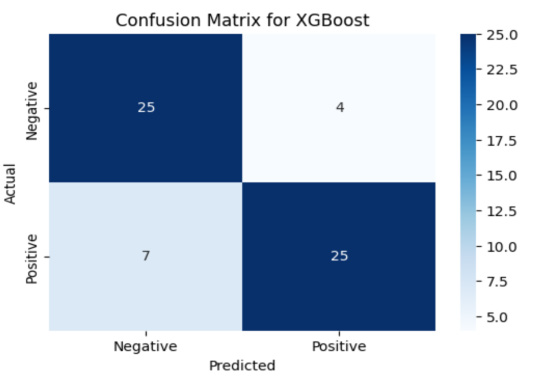
Extreme Gradient Boosting (XGBoost) is an advanced ensemble method that builds decision trees sequentially, where each new tree focuses on correcting the errors of the previous ones. It combines boosting with regularization techniques, resulting in a robust and efficient model capable of capturing intricate patterns. The final model utilized in this study is the XGBoost (Extreme Gradient Boosting) classifier, trained on the encoded and normalized cardiovascular dataset. Known for its ability to manage complex feature interactions and structured data efficiently, XGBoost achieves a high classification accuracy of 82%. The F1-scores are similarly balanced around 82%, reflecting the model’s consistency and robustness in classifying cardiovascular risk. These metrics confirm that XGBoost effectively captures subtle patterns in clinical and demographic features, outperforming both Logistic Regression and Random Forest in this study. Its ability to generalize well while maintaining high precision makes it a highly suitable choice for predicting the risk of cardiovascular disease. The confusion matrix shown in the figure provides a visual summary of the XGBoost model’s classification performance. It illustrates how well the model distinguishes between patients with and without cardiovascular disease. Each cell in the matrix represents the number of predictions made by the model, with the diagonal cells indicating correct predictions and the off-diagonal cells showing misclassifications. This visual tool is useful for identifying any bias or imbalance in the model’s predictions and complements the numerical evaluation metrics Figure 5.
Model Performance Comparison
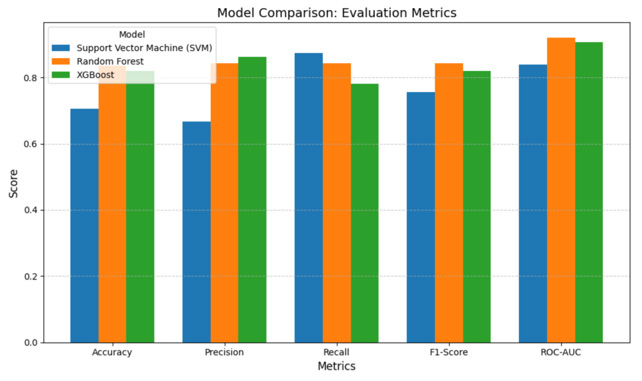
To evaluate which model performs best for Cardiovascular Disease (CVD) prediction, three machine learning algorithms Support Vector Machine (SVM), Random Forest, and XGBoost are compared based on key metrics such as accuracy, precision, and F1-score. All models are trained and evaluated using the same pre-processed dataset to ensure fairness in comparison. The Table 4 above shows the differences between all three models.
The Random Forest model emerges as the top performer, achieving the highest accuracy of 84%, and balanced precision of 84% and F1-scores of 84% across both classes. It demonstrates robust generalization with the fewest misclassifications, making it the most dependable model among the three. XGBoost also performs well with an accuracy of 82%, offering strong predictive capability with slightly higher variance between class-wise precision scores. Support Vector Machine (SVM), while simpler and easier to interpret, trails behind with an accuracy of 70%, and shows more misclassifications, indicating its limitations in capturing complex data relationships compared to ensemble methods. The bar chart below provides a clear visual comparison of the classification accuracy achieved by three machine learning models: Support Vector Machine (SVM), Random Forest, and XGBoost. Each model is trained on the same encoded and normalized dataset, ensuring a consistent and fair evaluation. The height of each bar represents the overall accuracy percentage on the test dataset. As depicted, Support Vector Machine yields the lowest accuracy at 70%, serving as a baseline model. XGBoost improves upon this by reaching 82%, benefiting from its ensemble structure that reduces variance. The highest accuracy, 84%, is achieved by Random Forest, which leverages gradient boosting and sophisticated regularization to generalize better on complex clinical data Figure 6.
Accuracy Vs Number of Trees
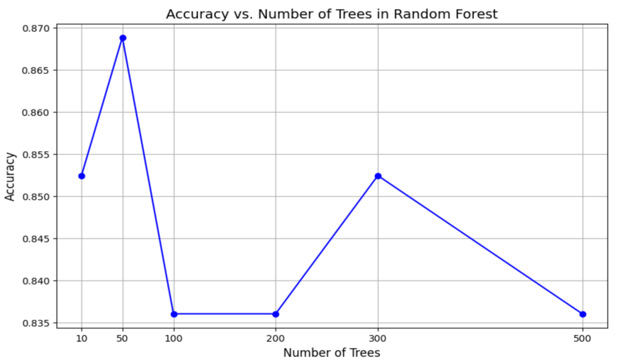
The graph in Figure 7 illustrates the relationship between the number of trees in a Random Forest model and its corresponding accuracy, highlighting how model performance changes with varying numbers of trees. Random Forest, an ensemble learning technique, builds multiple decision trees and aggregates their predictions to enhance accuracy and reduce overfitting. Initially, as the number of trees increases from 10 to 50, there is a significant improvement in accuracy, indicating the model becomes more robust with more trees. However, beyond 50 trees, the accuracy begins to fluctuate rather than follow a consistent trend. For instance, accuracy experiences a noticeable drop at 100 trees, followed by an improvement at 300 trees, and then declines again at 500 trees. These fluctuations may be attributed to randomness in tree construction or specific characteristics of the dataset, such as noise or class imbalance. The peak accuracy is observed at 50 trees, suggesting that this may be the optimal number of trees for this dataset, balancing accuracy and computational efficiency. As the number of trees increases further, the model exhibits diminishing returns, where additional trees do not significantly enhance performance and may even lead to a slight decline in accuracy. This emphasizes the importance of tuning the number of trees in a Random Forest model to achieve the best balance between performance and computational cost.
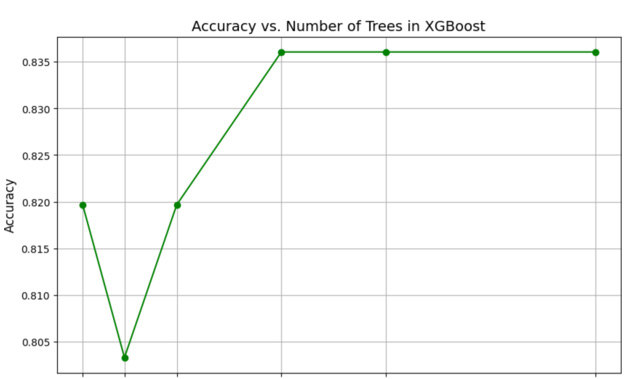
The graph in Figure 8 demonstrates the relationship between the number of trees in an XGBoost model and its accuracy, highlighting how performance evolves as the number of trees increases. XGBoost, an efficient gradient boosting algorithm, sequentially builds trees, with each one correcting the errors of the previous. Initially, at 50 trees, the model experiences a dip in accuracy compared to 10 trees, likely due to early-stage instability. However, as the number of trees increases to 100 and beyond, the accuracy improves significantly, showcasing the model’s ability to refine predictions over iterations. Beyond 200 trees, the accuracy plateaus indicate that additional trees do not improve performance further. The highest accuracy is achieved at 200 trees, suggesting it as the optimal number for this dataset. This behaviour underscores the importance of tuning the number of trees in XGBoost to balance model performance and computational efficiency.
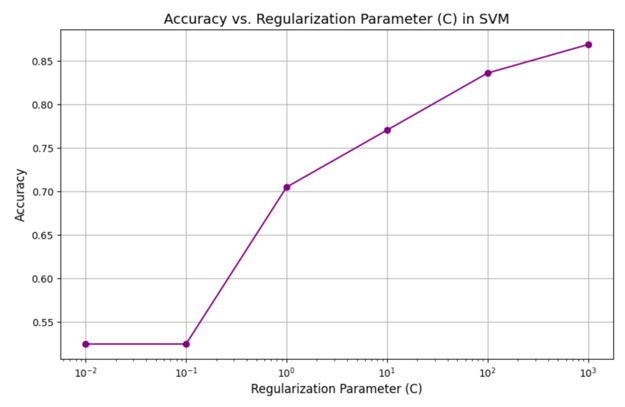
The graph in Figure 9 illustrates the relationship between the regularization parameter (C) and the accuracy of an SVM (Support Vector Machine) model, demonstrating how the model’s performance is influenced by different values of C. The regularization parameter C controls the trade-off between achieving a low error on the training data and maintaining a simpler decision boundary to prevent overfitting. At very small values of C (e.g., (10^{-2})), the model prioritizes simplicity, which may result in underfitting and lower accuracy as it allows for more misclassifications. As C increases (e.g., from (10^{-1}) to (10^{1})), the accuracy improves significantly, indicating that the model is better fitting the training data by reducing the margin violations (i.e., penalizing misclassified points more heavily). At very high values of C (e.g., (10^{2}) and (10^{3})), the accuracy continues to rise, suggesting that the model is closely fitting the training data. However, excessively large values of C may risk overfitting, where the model becomes too sensitive to the training data and may not generalize well to unseen data. This graph highlights the importance of carefully tuning the regularization parameter C to achieve an optimal balance between bias and variance, ensuring robust performance.
Discussion
The predictive performance of all three machine learning models Support Vector Machine (SVM), Random Forest, and XGBoost demonstrates the potential of structured clinical data in identifying individuals at risk of Cardiovascular Disease (CVD). Among these, Random Forest emerges as the most accurate model, achieving an impressive 84% accuracy, slightly outperforming XGBoost (82%) and significantly surpassing Support Vector Machine (70%). This result aligns with the strengths of Random Forest, which excels in capturing nonlinear patterns and feature interactions in structured data. The confusion matrix for the Random Forest model reflects its strong classification ability, correctly identifying 27 out of 32 CVD patients and 24 out of 29 non-CVD individuals, with only 5 total misclassifications. This distribution indicates that the model is not only accurate but also well-balanced in classifying both positive and negative cases, making it suitable for medical decision-making scenarios where false negatives can have grave consequences.
Feature Importance Analysis
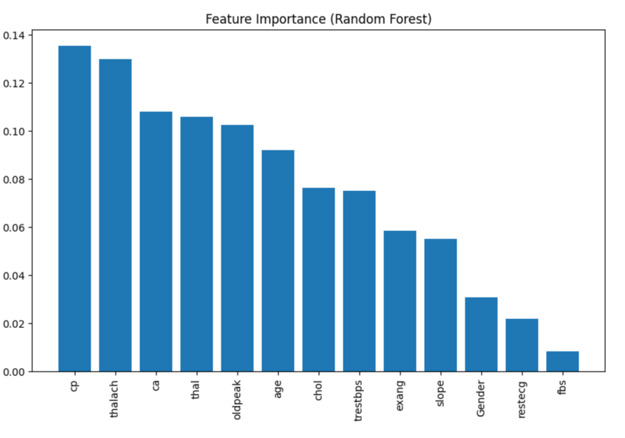
To understand which variables, contribute most significantly to the model’s decisions, the feature importance graph derived from the Random Forest model provides valuable insights. Features such as thal (thalassemia), cp (Chest Pain type), ca (number of major vessels colored by fluoroscopy), and oldpeak (ST depression induced by exercise) stand out as the most influential predictors of CVD risk. These variables are also clinically relevant, further validating the model’s learning from real-world patterns. These findings suggest that the model effectively captures complex interdependencies in patient data, providing interpretable results that align with medical understanding.
Feature Importance Visualization
To gain insights into how the machine learning model makes decisions, feature importance analysis is conducted using the Random Forest classifier. This analysis ranks each input variable based on how much it contributes to improving the model’s predictions across all decision trees. Features with higher importance scores are those that the model relies on more heavily to distinguish between patients with and without cardiovascular disease.
Before diving into complex explainability tools, traditional feature importance from tree-based models like Random Forest provides an excellent starting point for interpretation. This kind of analysis is valuable in medical research, as it helps bridge the gap between model accuracy and clinical relevance.
In this study, the most influential features include:
1. thal (thalassemia),
2. cp (chest pain type),
3. ca (number of vessels colored by fluoroscopy),
4. thalach(maximum heart rate),
These variables align with clinical expectations and are often used in diagnostic contexts, reaffirming the model’s validity in real- world applications. The visualization in Figure 10 shows that thal (thalassemia), cp (Chest Pain type), thalach (maximum heart rate) and ca (number of vessels colored by fluoroscopy) are the most impactful predictors. Understanding this allows medical professionals to better trust and interpret the model’s suggestions, improving transparency and confidence in deployment scenarios.
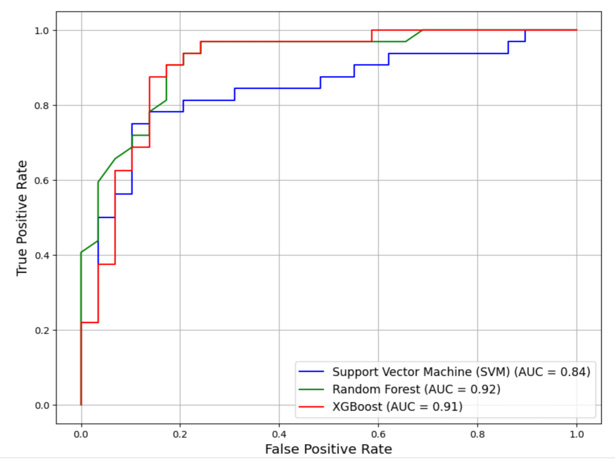
A binary classifier’s performance is graphically represented by the Receiver Operating Characteristic (ROC) curve. With different categorization criteria, it shows the True Positive Rate (TPR) vs. the False Positive Rate (FPR). The Area Under the ROC Curve (AUC) is a scalar metric that measures both the classifier’s sensitivity and specificity while also reflecting the classifier’s overall performance. As depicted in Figure 11, both XGBoost and random forest models exhibit a high AUC of above 0.9 whereas the Support Vector Machine (SVM) exhibit only 0.84. The Random Forest (RF) models have a highest AUC of 0.92.
Conclusion
This research explores the application of supervised machine learning techniques for the early prediction of cardiovascular disease using structured clinical and demographic data. Through rigorous data preprocessing steps including imputation of missing values, outlier removal via the Z-score method, normalization, and encoding of categorical variables the dataset is refined to ensure consistency, accuracy, and reliability for model training. Three machine learning models are implemented: Support Vector Machine (SVM), Random Forest, and XGBoost. Each model is evaluated based on performance metrics such as accuracy, precision, and F1-score. Support Vector Machine (SVM) served as a baseline and achieved an accuracy of 70%, while XGBoost slightly outperformed it with 82%. The Random Forest model emerged as the best-performing classifier, attaining an accuracy of 84% and demonstrating strong predictive reliability for both CVD and non-CVD cases.
Feature importance analysis revealed that variables like thalassemia, chest pain type, ST depression, and number of major vessels significantly influence prediction outcomes. To demonstrate real-world application, the final model is tested on a simulated new patient profile. The model successfully predicted the health status, emphasizing its practical utility for clinical decision support systems. The workflow developed in this study offers a reproducible and scalable pipeline that can be integrated into early screening frameworks, potentially supporting physicians in identifying highrisk individuals before the onset of severe complications. In summary, this research underscores the effectiveness of machine learning models particularly ensemble methods like Random Forest for healthcare analytics. These models provide actionable insights that can assist in the development of intelligent, data-driven tools for preventive cardiology, paving the way for more personalized and timely patient care.
Conflicts of Interest
None
Acknowledgements
None.
References
- RC Deo (2015) Machine learning in medicine. Circulation 132(20): 1920-1930.
- Z Obermeyer, EJ Emanuel (2016) Predicting the future-Big data, machine learning, and clinical medicine. N Engl J Med 375(13): 1216-1219.
- SF Weng, J Reps, J Kai, JM Garibaldi, N Qureshi (2017) Can machine-learning improve cardiovascular risk prediction using routine clinical data? PLoS One 12(4): e0174944.
- KW Johnson, J Torres Soto, BS Glicksberg, K Shameer, R Miotto, et al. (2018) Artificial intelligence in cardiology. J Am Coll Cardiol 71(23): 2668-2679.
- S Mohan, C Thirumalai, G Srivastava (2019) Effective Heart Disease Prediction Using Hybrid Machine Learning Techniques. IEEE Access 7: 81542-81554.
- Shah D, Patel S, Bharti SK (2020) Heart Disease Prediction using Machine Learning Techniques. SN COMPUT SC 1: 345.
- C Krittanawong, H Zhang, Z Wang, M Aydar, T Kitai (2020) Artificial intelligence in precision cardiovascular medicine. J Am Coll Cardiol 69(21): 2657-2664.
- Guo Y, Hao Z, Zhao S, Gong J, Yang F (2020) Artificial Intelligence in Health Care: Bibliometric Analysis. J Med Internet Res 22(7): e18228.
- Abdeldjouad FZ, Brahami M, Matta N (2020) A Hybrid Approach for Heart Disease Diagnosis and Prediction Using Machine Learning Techniques. In: Jmaiel M, Mokhtari M, Abdulrazak B, Aloulou H, Kallel S (eds) The Impact of Digital Technologies on Public Health in Developed and Developing Countries. ICOST 2020. Lecture Notes in Computer Science 12157.
- Chicco D, Jurman G (2020) Machine learning can predict survival of patients with heart failure from serum creatinine and ejection fraction alone. BMC Med Inform Decis Mak 20(1): 16.
- Ji Nan, Ting Xiang, Paolo Bonato, Nigel H Lovell, Sze-Yuan Ooi, et al. (2021) Recommendation to Use Wearable-Based mHealth in Closed-Loop Management of Acute Cardiovascular Disease Patients during the COVID-19 Pandemic. IEEE J Biomed Health Inform 25(4): 903-908.
- Kishor A, Jeberson W (2021) Diagnosis of Heart Disease Using Internet of Things and Machine Learning Algorithms. In: Singh PK, Wierzchoń ST, Tanwar S, Ganzha M, Rodrigues, JJPC (eds) Proceedings of Second International Conference on Computing, Communications, and Cyber-Security. Lecture Notes in Networks and Systems, 203.
- Hassan Ch Anwar ul, Jawaid Iqbal, Rizwana Irfan, Saddam Hussain, Abeer D Algarni, et al. (2022) Effectively Predicting the Presence of Coronary Heart Disease Using Machine Learning Classifiers. Sensors 22(19): 7227.
- Gour S, Panwar P, Dwivedi D, Mali C (2022) A Machine Learning Approach for Heart Attack Prediction. In: Nagar, AK Jat DS, Marín-Raventós G, Mishra DK (eds) Intelligent Sustainable Systems. Lecture Notes in Networks and Systems 333.
- Subahi, Ahmad F, Osamah Ibrahim Khalaf, Youseef Alotaibi, Rajesh Natarajan, et al. (2022) Modified Self-Adaptive Bayesian Algorithm for Smart Heart Disease Prediction in IoT System. Sustainability 14(21): 14208.
- Abdalrada AS, Abawajy J, Al-Quraishi T, Sheikh Mohammed Shariful Islam (2022) Machine learning models for prediction of co-occurrence of diabetes and cardiovascular diseases: a retrospective cohort study. J Diabetes Metab Disord 21(1): 251-261.
- Truong VT, Nguyen BP, Nguyen-Vo TH, Wojciech Mazur, Eugene S Chung, et al. (2022) Application of machine learning in screening for congenital heart diseases using fetal echocardiography. Int J Cardiovasc Imaging 38(5): 1007-1015.
- Saeedbakhsh Saeed, Mohammad Sattari, Maryam Mohammadi, Jamshid Najafian, and Farzaneh Mohammadi (2023) Diagnosis of Coronary Artery Disease Based on Machine Learning Algorithms Support Vector Machine, Artificial Neural Network, and Random Forest. Adv Biomed Res 12(1): 51.
- Baghdadi NA, Farghaly Abdelaliem SM, Malki A, et al. (2023) Advanced machine learning techniques for cardiovascular disease early detection and diagnosis. J Big Data 10: 144.
- Vyshnya Sofiya, Rachel Epperson, Felipe Giuste, Wenqi Shi, Andrew Hornback, et al. (2024) Optimized Clinical Feature Analysis for Improved Cardiovascular Disease Risk Screening. IEEE Open J Eng Med Biol 5: 816-827.
- Syed Muhammad Saqlain, Muhammad Sher, Faiz Ali Shah, Imran Khan, Muhammad Usman Ashraf, et al. (2019) Fisher Score and Matthews Correlation Coefficient-Based Feature Subset Selection for Heart Disease Diagnosis Using Support Vector Machines. Knowledge and Information Systems 58 (1): 139-167.
- Bhatt Chintan M, Parth Patel, Tarang Ghetia, Pier Luigi Mazzeo (2023) Effective Heart Disease Prediction Using Machine Learning Techniques. Algorithms 16(2): 88.





 We use cookies to ensure you get the best experience on our website.