Short Communication 
 Creative Commons, CC-BY
Biphasic P Waves–Paying Attention to Details
*Corresponding author: Jochanan E Naschitz, Bait Balev Nesher and The Ruth and Bruce Rappaport Faculty of Medicine, Technion, Israel Institute of Technology, Haifa, Israel.
Received: June 26, 2019; Published: July 25, 2019
DOI: 10.34297/AJBSR.2019.04.000779
Introduction
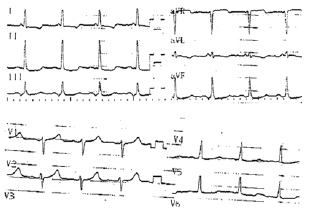
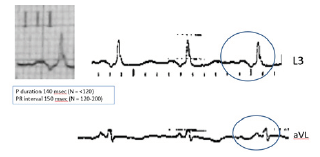
On a rather usual electrocardiogram (ECG) a rather unusual morphology of the P waves provided the chance for my young colleagues and me, the veteran, to sharpen some of our professional skills. The Case: The patient, a 69-year-old man, was transferred for rehabilitation in the following of mitral and aortic valve replacement. The ECG on admission showed sinus rhythm, 98 bpm, and left ventricular strain (Figure 1). On closer inspection (Figure 2), the P wave duration 140 msec is consistent with intra-atrial conduction delay, i.e. inter-atrial block. The P waves are biphasic in the limb leads. The first component of the P waves is positive in leads II, III and aVF, that means that the vector is directed downward toward the atrioventricular node. The late component of the P wave is opposed to the first, engraving a negative spike in leads III and aVF and a positive spike in lead aVL. This late P vector moves away from the atrio-ventricular node and upward to the farer areas of the left atrium. The 150 msec normal PR interval shows that arrival of the depolarization vector to the ventricles is not late. The questions are: where in the atrial walls is the site of the delay and what is the explanation for the to-and-fro atrial depolarization?
Discussion
During sinus rhythm the P waves are positive in lead II and usually in leads I, aVL, and aVF, reflecting the leftward and inferior direction of activation. This corresponds to a mean frontal plane P wave axis of approximately 60 degrees. The normal P wave duration upper limit is conventionally 120 milliseconds, as measured in the lead with the widest P wave. The normal PR interval measures 120 to 200 milliseconds in adults. In normal hearts, the activation wave spreads from the right to the left atrium through specific connections of working myocardium, localized in the antero-superior septum (Bachmann’s bundle) and in areas near the fossa ovalis. The conduction occurs most commonly through the Bachmann’s bundle and less frequently through the other connections. P wave patterns may suggest the site of impulse formation and the path of subsequent activation [1].
Conduction delay between the atria alters the duration and pattern of P waves. When conduction from the right to the left atrium is delayed, the normal lag in left atrial activation relative to that of the right atrium increases. P wave duration is prolonged beyond 120 milliseconds and P waves typically have two humps in lead II (“P mitrale”), with the first representing right atrial and the second left atrial depolarization. With more advanced block, the sinus node impulses reach the left atrium only after passing inferiorly toward the atrio-ventricular junction and subsequently superiorly through the left atrium. In such case, P waves are wide and biphasic with an initial positive deflection in the inferior leads followed by a negative deflection. Bayés de Luna et al. [2,3] classified these types of block as either a partial block, when the only ECG abnormality is a P wave that equals or exceeds 120 msec or an advanced block, indicated by a P wave duration of ≥120ms and a biphasic (+/−) pattern in the inferior leads (II, III, and VF).
This biphasic morphology is caused by retrograde activation of the left atrium due to a complete block in the Bachmann’s bundle, as demonstrated in humans under electrophysiologic mapping [4,5]. Advanced inter-atrial block is frequently associated with left atrial enlargement but may manifest independently of left atrial size [6], and it increases with age probably owing to atrial fibrosis. Inter-atrial block is an independent predictor of supraventricular tachyarrhythmias, and it has been associated with left atrial thrombi and systemic embolization. In the case we now present, the inter-atrial block is not supposed to add to the risk of complications inherent to the patient’s basic cardiovascular disorder. For the physicians, the unusual P wave morphology occasioned a mental challenge and provided an opportunity to refine our diagnostic skills.
References
- Mirvis DM, Goldberger AL (2019) In: Braunwald’s Heart Disease: A Textbook of Cardiovascular Medicine 12: 117-153.
- Bayés de Luna A, Baranchuk A, Alberto Escobar Robledo L, Massó van Roessel A, et al. (2017) Diagnosis of interatrial block. J Geriatr Cardiol 14(3): 161-165.
- Bayés de Luna A, Escobar-Robledo LA, Aristizabal D, Weir Restrepo D, Mendieta G, et al. (2018) Atypical advanced interatrial blocks: Definition and electrocardiographic recognition. J Electrocardiol 51(6): 1091- 1093.
- Knol WG, Teuwen CP, Kleinrensink JG, Bogers Ad JJC, de Groot NMS, et al. (2018) Bachmann’s Bundle and interatrial conduction; comparing atrial morphology to electrical activity. Heart Rhythm 16(4): 606-614.
- Fernandez-Fernandez FJ (2017) Prolonged P wave with biphasic morphology in the inferior leads. Eur J Intern Med 39: e5-e6.
- Petersson R, Berge HM, Gjerdalen GF, Carlson J, Holmqvist F, et al. (2014) P-wave morphology is unaffected by atrial size: a study in healthy athletes. JACC 63: A1650-A1650.


 We use cookies to ensure you get the best experience on our website.