Research Article 
 Creative Commons, CC-BY
Screening of Fifteen Sugarcane Genotypes under Irrigation based on Genetic Variations and Heritability for Agro-morphological Traits at Early Selection Stage in Ferké, Ivory Coast
*Corresponding author: Crépin B Péné, SUCAF-CI/SOMDIAA, Research and Development Department, 22 rue des Carrossiers, Treichville Zone 3, PO. Box 1967 Abidjan 01, Ivory Coast
Received: August 06, 2019 Published: August 22, 2019
DOI: 10.34297/AJBSR.2019.04.000835
Abstract
The study aimed to determine the best performing early-season sugarcane genotypes tested at the first selection stage under sprinkler irrigation, in comparison with a check variety (R579). The experimental design used was a randomized complete block (RCB) with 17 cane genotypes in three replications. Every plot consisted of five dual rows of ten meters with 0.5 and 1.90 m of inter-row spacing, i.e. 95 m² per plot and about 5000 m² for the whole experiment. It was carried out on a commercial sugarcane plantation of Ferké 2 located in the northern part of the country, over two seasons (plant cane and first ratoon) as an early-season crop from November 18, 2015 to December 05, 2017. Over each micro-plot, data based on different agro-morphological traits were collected at harvest from three central dual rows. The study showed that based on sugar yields, six genotypes higher or equivalent to check varieties used, namely N47, R95-2202, ECU01, R97-0391, N49 and CP98-1029, were found promising for the next and final advanced selection stage, with respectively 20.3, 16.5, 15.2 , 14.2, 13.3 and 13.3 t sugar/ha. Their cane yield performances ranged from 115.8 to 160.8 t/ha compared to 160.4 and 134.0 for check varieties R579 and SP70-1006, respectively. Not only sugar yield, but also, recoverable sucrose, cane internode infestation rate and number of tillers per hectare were found as the most relevant agro-morphological traits in genetic variation of sugarcane genotypes tested in line of their higher broad sense heritability values.
Keywords: Juice Quality; Sugar Yield; Phenotypic Correlation; Genotypic Correlation; Coefficient of Variation; Genetic Advance
Introduction
In addition to be a source of sucrose, sugarcane is an important bioenergy crop, with an energy ratio of ethanol production five times higher than that of maize [1-3]. It used to be considered as a feedstock for production of advanced biofuel due to its superior contribution to reduce the life cycle greenhouse gas emission in the fight against global warming and climate change [4]. As a result of its advantages as cash crop like very high biomass production and well-established technologies regarding farming, harvesting as well as processing, sugarcane is a leading candidate for bioenergy production and a feedstock for bio-refineries. However, productivity improvements in sugarcane have been negligible in the past three decades, and production statistics are reflecting decreased yields globally [5]. In all cases, increased sugarcane production is linked to expansion of land surface rather than increase in yield [6-8].
In all sugarcane breeding programs worldwide, the key targeted traits are resistance to important local diseases and pests, commercially extractable sucrose content, cane yield, acceptable fiber content and ratooning performance. In some programs, other traits affecting costs of harvesting or crop management are of importance. Sugarcane varieties tend to run out or decline after some years of cultivation in a specific area [9]. To obtain high yields on a sustainable basis, it has been essential to substitute varieties regularly grown with new clones. Sugarcane varieties are clonally propagated and therefore are not expected to undergo genetic changes as it may occur in a seed propagated crop except for the variety decline over several ratoons due to disease incidence and other environmental constraints with therefore a need for replacement [10].
Breeding high performing commercial cultivars is crucial for maintaining sugarcane production, which will benefit from research in sugarcane genome sequencing and genetic mapping. These research areas focused on understanding sugarcane’s genome structure, organization and inheritance patterns. They also help in understanding genetic variations within sugarcane populations or germplasms that control important agronomic traits [7]. Often, the ultimate objective of sugarcane breeding programs is to release varieties which improve the profitability of the sugar industry being targeted. That is why breeders need to determine the optimal weightings that should be applied to each agro-morphological to be investigated. A first step towards this involves identifying all traits influencing industry stakeholders and determining the relative economic value of variation in each trait, preferably in quantitative terms [8]. As industries change, the economic value of traits may change. In recent decades, weightings of some traits have changed in response to developments such as the introduction of mechanized harvesting, increased use of sugarcane for energy production and change in agronomic practices.
The objective of study was to determine the best performing early-season sugarcane genotypes under irrigation at the first selection stage for different agro-morphological traits based on their genetic variations and heritability.
Material and Methods
Site Characteristics
The study was carried out on Ferké 2 sugarcane field N1-005, sprinkler irrigated with center pivot, in northern Ivory Coast (9°20’-9°60’ N, 5°22’-5°40’ O, 325 m a.s.l.). The prevailing climate is tropical dry with two seasons: one, starting from November to April, is dry and the other, from May to October, is wet. The dry season is marked by the boreal trade wind which blows over mid- November to late January. The rainfall pattern is unimodal and centered on August and September which total amount of rainfall reaches almost half of the average annual rainfall (1200 mm) with an average daily temperature of 27 °C. Average maximum and minimum daily air temperatures are 32.5 and 21 °C, respectively. To meet sugarcane crop water requirements, the total amount of irrigation water required reaches 700 mm/year [11-13]. Both Ferké sugar mill plantations cover around 15 500 ha with 10 000 ha under irrigation and 3 500 ha of rainfed village plantations, lie mainly on shallow or moderately deep soils built up on granites. Main soil units encountered are ferralsols and temporally waterlogged soils in valley bottoms of Bandama and Lokpoho river basins with a sandy-clay texture.
Cane Genotypes used
All 17 cane genotypes tested were commercial varieties of seven different origins (Reunion, South Africa, Thailand, Ecuador, USA, Philippines and Brazil). They were provided by the Montpellier sugarcane quarantine of CIRAD (International Centre for Agricultural Research and Development) in France. The heterozygous and polyploidy nature of sugarcane has resulted in generations of greater genetic variability. Knowledge on the nature and the magnitude of variability present in the genetic material is therefore of prime importance for breeders to conduct an effective selection program. Coefficients of variation along with heritability as well as genetic advance are very essential to improve any trait of sugarcane because this would help in knowing whether the desired objective can be achieved from the material to be investigated [14].
Experimental design
The experiment was carried out over two consecutive years, as early-season trial in plant and first ratoon crops, from November 18, 2015 to December 05, 2017 following a randomized complete block design (RCBD) with 17 different genotypes, including the check varieties R579 and SP70-1006, in 3 replicates. A plot comprised 5 dual rows of 5 m long with narrow and wide spacings of 0.50 m and 1.90 m. Field managements in terms of sprinkler irrigation, fertilizer and herbicide applications were done according to usual practices in commercial plantations. NKP fertilizer (16-8.5-23) was applied mechanically at the routine rates of 812.5 kg/ha in plant cane and 937.5 kg/ha in first ratoon. Pre-emergence chemical weeding based on pendimethalin combined with clorimuron-ethyl (3.5 l/ha) was achieved mechanically two days after planting.
Agronomic Traits investigated
Data were collected at harvest from three central dual rows for millable stalk number/ha, cane yield, agro-morphological traits (stalk weight, stalk diameter, stalk height, number of internodes), juice quality traits (sucrose, purity, and recoverable sucrose), fiber content, and damaged internodes by stem borer Eldana saccharina. At harvest, burned cane fresh production of the three dual rows of each plot was weighed separately to determine crop yield. Moreover, 50 millable stalks were randomly chosen within every plot and split longitudinally with a machete in order to determine the percentage of bored or attacked internode and cane (%BIN, %BC) by stem borer.
Thirty millable cane stalks were sampled per plot for sucrose analyses in the laboratory. Prior to sample grinding operations in the laboratory for sucrose analyses, every stalk was cut into 3 pieces of almost equal length while separating them in basal, median and top parts. This allowed to randomly reconstitute 3 batches of 10 stalks for a better homogenization of the initial field sample by permutation of the pieces so that each reconstituted stalk was composed of parts coming from 3 different cane stalks. Eventually, only one batch of 10 reconstituted stalks over 30 (1/3 of initial sample) were ground for a series of sucrose analyses to determine the sucrose content (Pol %C), fiber content (Fiber %C), juice purity (Purity %C) and recoverable sucrose (SE%C). Equipment used comprised a Jefco cutter grinder, a hydraulic press (Pinette Emideceau), a digital refractometer BS-RFM742 and a digital polari-meter SH-M100. Methods used in the determination of required technological parameters were reported by Hoarau [15].
The recoverable sucrose was calculated as follows [16-17]:
SE %C = [(0.84 x Pol%C) (1.6 -60/Purity) - (0.05 x Fib %C)] with:
Purity %C = (Pol juice/Brix) x 100 and Pol juice = Pol factor x Pol read.
Pol%C = Factor n x Pol juice
Factor pol depending on brix value (amount of soluble dry matter in juice measured with a refractometer) is provided by Schmidt table relative to a polarimeter for 26 g of glucose. The fiber content and factor n were provided by a table depending on the weight of fiber cake obtained after pressing 500 g of cane pulp resulting from the grinding operation of every sample of cane stalks.
Phenotypic and Genotypic Coefficients of Variation, Heritability and Genetic advance
The phenotypic and genotypic variances for each trait were estimated from the RCBD analysis of variance (Table 1). The expected mean squares under the assumption of random effects model was computed from linear combinations of mean squares were determined as follows (Burton and Davane [18], cited by Shitahum et al [19]):
Genotypic variance (σ²g) = (MS g – MS e)/r
Environmental variance (σ²e) = MSe
Phenotypic variance (σ²p) = σ²g + σ²e
Where MSg and MSe are mean sum of squares for genotypes and error in the analysis of variance, respectively, and r the number of replicates.
Genotypic and phenotypic coefficients of variation (GCV, PCV) were computed as follows [20]:
GCV = σg x100/grand mean
PCV = σp x100/grand mean
Broad sense heritability h² = 100 x σ²g / σ²p
Genetic advance (GA) and genetic advance as percent mean (GAM): GA = k x h² x σp and GAM = 100 x GA/X
With k: standard selection differential at 5 % selection intensity (k = 2.063) and X: grand mean of trait X.
Phenotypic and genotypic correlation coefficients rp and rg between pairs of traits A and B are defined as [21]:
rp = Covp (A, B)/ (σpA x σpB)
rg = Covg (A, B)/ (σgA x σgB)
where Covp and Covg are phenotypic and genotypic covariances, respectively.
Phenotypic correlations between traits were determined following the Pearson correlation coefficient calculated from means of observed traits for each cane genotype [22]. Genetic improvement in cane and sugar yields may be achieved by targeting traits closely associated to them. Several attributes have been proposed as indirect selection criteria for genetic improvement of yields in plant breeding programs [23-24]. Heritability represents the relative importance of genetic and environment factors in the expression of phenotypic and genotypic differences among genotypes within a population [25-27]. Consequently, the knowledge of heritability related to important traits and the correlations among them are key issues to determine the best selection strategy [28-29]. Genotypic coefficient of variation (GCV) is another measure of relative genetic variation of a trait within a population [30]. Chaudhary [31] reported high GCV for single stalk weight and millable cane number per unit area. Genotype x environment interactions (GxE) are a serious concern in breeding programs as they affect selection decisions. When a rank of a genotype changes across environments, it requires evaluation of genotypes across environments to determine their real value [32]. Studies in various sugarcane breeding programs have reported significant GxE interactions for cane and sugar yields [33-34].
Statistical analyses
The quantitative data recorded in this study were subjected to the analysis of variance using statistical procedures described by Gomez and Gomez [35] and reported by Shitahum et al. [36] with the assistance of R software package version 3.5.1 (Table 1). Differences between means of treatments were determined from Duncan test [37-40].
Results and Discussion
Climatic conditions over plant and first ratoon crops
Total amount of rainfall and reference evapotranspiration recorded in first ratoon decreased by 5 and 2.4%, respectively, compared to that of plant cane (Figure 1). In absolute values, they varied from 1274 to 1216 mm and from 1468 to 1433 mm,respectively. Variations of average daily air temperatures were negligible from one crop cycle to the other, with 28.1°C as absolute value. Total water deficit over the dry season (from November to July) to be fulfilled with irrigation water gave nearly 410 mm in plant cane and 450 mm in first ratoon.
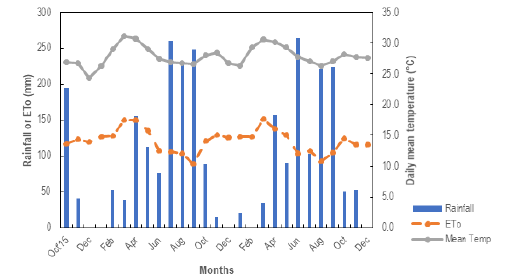
Figure 1: Prevailing climate of the experimental site over crop cycle (plant and 1rst ratoon crops) in Ferké 2, Ivory Coast.
Performance of cane genotypes tested in plant and first ratoon crops
In plant cane, except for stem borer infestation rates in terms of cane and internode bored, and number of internodes with no significant differences within genotypes (P>0.5), highly significant differences (P<0.01) were observed for all agro-morphological traits investigated (Tables 2&3). Based on sugar yields, eight genotypes higher or equivalent to the first check variety R579, namely N47, R95-2202, ECU01, R97-0391, N49, CP98-1029, R93- 6480 and MPT97-130 were found promising for the next advanced selection stage with values ranging from 11.0 to 15.6 t sugar/ha. Their cane yield performances ranged from 115.9 to 143.2 t/ha compared to 140.0 and 137.5 t/ha for the check varieties R579 and SP70-1006, respectively. Juice quality and therefore sugar yield performances were affected by a relatively high level of stem borer infestations recorded on promising genotypes, with values ranging from 10 to 17 %BIN due to high rate of nitrogen fertilizer applied in plant cane (130 kg N/ha). Stalk borer infestation rates recorded in plant cane on check varieties gave 18 and 11% for R579 and SP70- 1006, respectively.
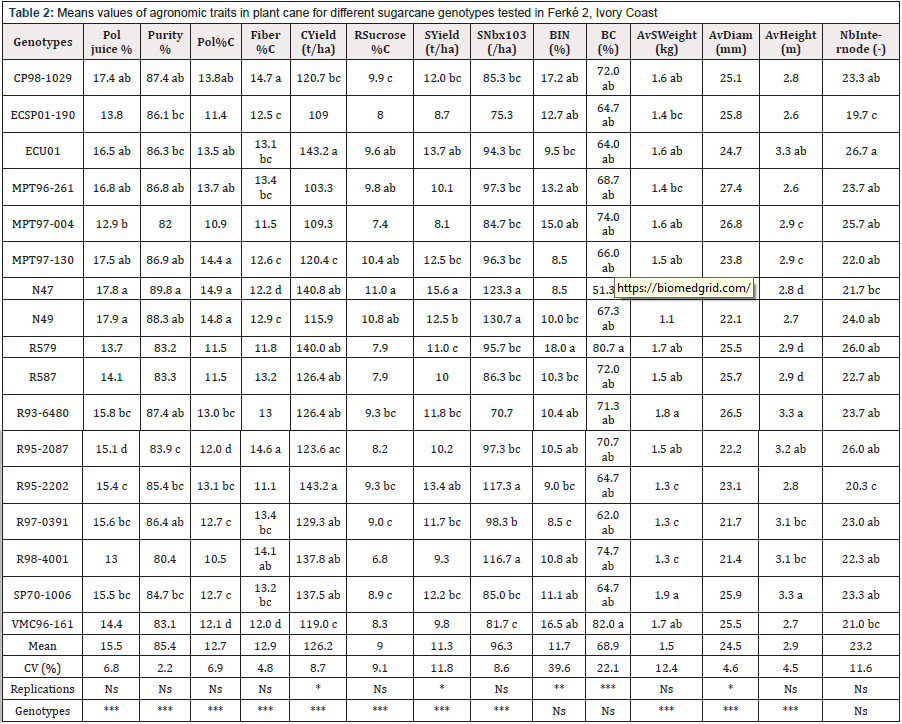
Table 2: Means values of agronomic traits in plant cane for different sugarcane genotypes tested in Ferké 2, Ivory Coast
SNb: Millable stalk number/ha; BIN: bored internode; BC: bored cane; AvSWeight: average single stalk weight; Av Height: average stalk height; ns: non-significant *, **,***: significant at 5, 1 and 0.1% levels of probability.
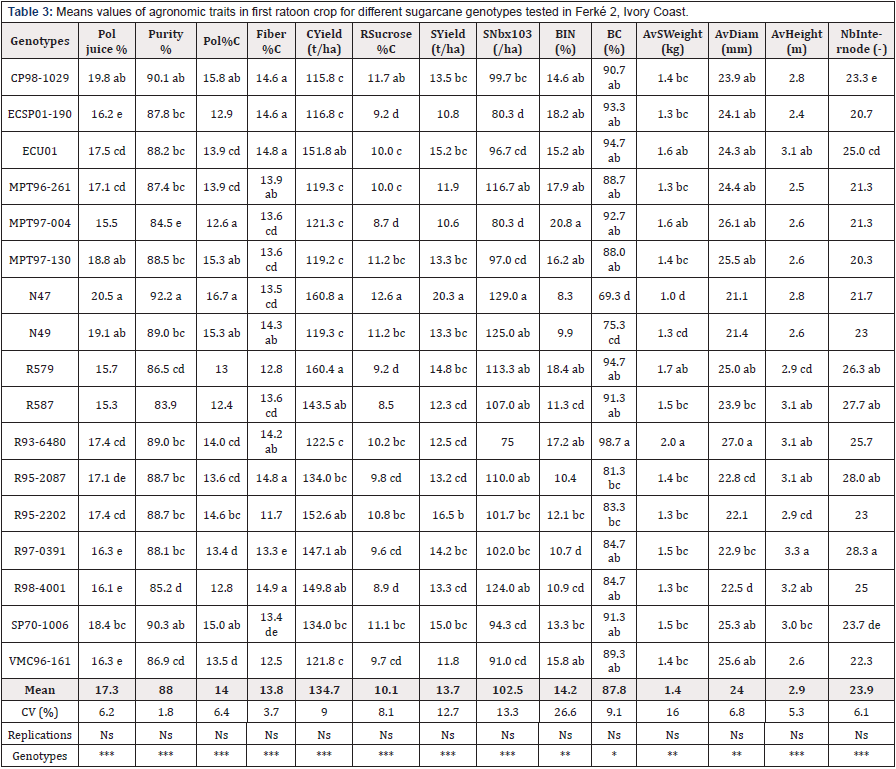
Table 3: Means values of agronomic traits in first ratoon crop for different sugarcane genotypes tested in Ferké 2, Ivory Coast.
SNb: millable stalk number/ha; BIN: bored internode; BC: bored cane; AvSWeight: average single stalk weight; AvHeight: average stalk height; ns: non-significant *, **, ***: significant at 5, 1 and 0.1% levels of probability.
In first ratoon crop, except for stem borer infestation rates in terms of cane and internode bored, and number of internodes with no significant differences within genotypes (P>0.5), highly significant differences (P<0.01) were observed for all agromorphological traits investigated (Tables 2&3). Based on sugar yields, six genotypes higher or equivalent to the first check variety R579, namely N47, R95-2202, ECU01, R97-0391, N49, CP98-1029, were promising for the next advanced selection stage with values ranging from 13.5 to 20.3 t sugar/ha compared to 14.8 and 15.0 for check varieties R579 and SP70-1006, respectively. Their cane yield performances ranged from 115.8 to 160.8 t/ha compared to 160.4 and 134.0 t/ha for check varieties R579 and SP70-1006, respectively. Juice quality and therefore sugar yield performances were also affected in first ratoon by relatively high levels of stem borer infestation recorded on promising genotypes, with values ranging from 8 to 17 %BIN due to high rate of nitrogen fertilizer applied in first ratoon crop (160 kg N/ha). Stalk borer infestation rates recorded in first ratoon on check varieties gave 18 and 13% for R579 and SP70-1006, respectively.
Phenotypic correlations between pairs of agro-morphological traits
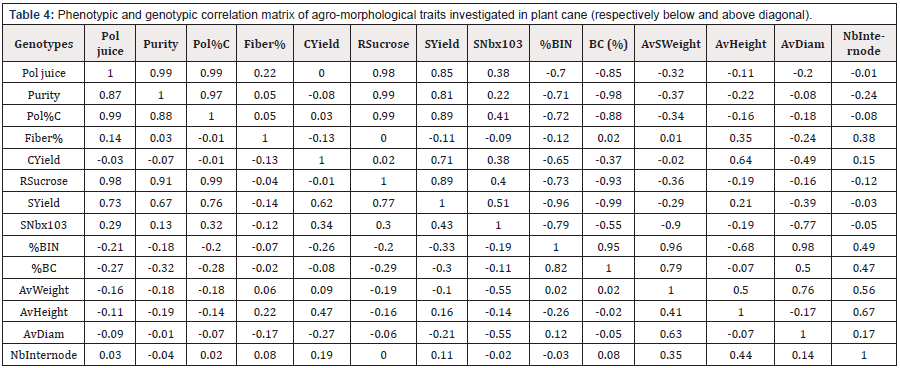
Table 4: Phenotypic and genotypic correlation matrix of agro-morphological traits investigated in plant cane (respectively below and above diagonal).
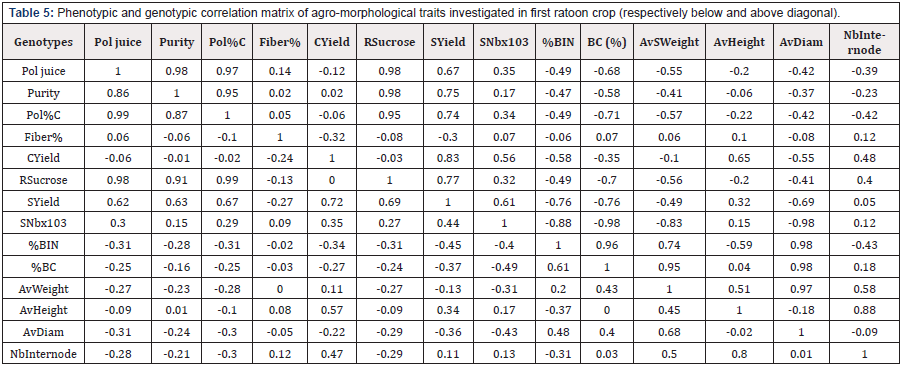
Table 5: Phenotypic and genotypic correlation matrix of agro-morphological traits investigated in first ratoon crop (respectively below and above diagonal).
Over both crop cycles (Tables 4&5), all juice quality traits (pol juice, purity, sucrose content, and recoverable sucrose) were positively, strongly and highly significantly correlated between pairs (r=0.86-0.99). All juice quality traits were also positively, moderately correlated to sugar yield (r=0.62-0.77). Internode and stalk infestation rates due to stem borer were also positively correlated moderately or strongly with coefficients equal to 0.82 and 0.61, respectively in plant cane and first ratoon. In contrast, they were loosely correlated and mostly not significantly (r=- 0.01-0.07). The millable stalk number per hectare was positively and moderately correlated to cane (r=0.34-0.35) and sugar yields (r=0.43-0.44), while negatively to average single stalk weight (r=-0.55, -0.31) and diameter (r=-0.55, -0.43). The average single stalk weight was positively and moderately correlated to agromorphological characters like stalk diameter (r=0.63, 0.68), stalk height (r=0.41, 0.45) and number of internodes (0.35, 0.50).
Genotypic correlations between pairs of agromorphological traits
Over both crop cycles (Tables 4&5), juice quality and sugar yield traits were positively and strongly correlated between pairs (r=0.87 - 0.99). Similar correlation was observed not only with cane and sugar yields (r=0.71), but also between sugar yield and characters like juice quality (pol juice, purity, recoverable sucrose) with coefficients ranging from 0.81 to 89. It was also observed between the internode number and traits like single stalk weight and average stalk height (r=0.56-0.88). Internode and stalk infestation rates due to stem borer were also positively correlated strongly with coefficients equal to 0.95 and 0.96, respectively in plant cane and first ratoon. That strong genotypic linear correlation may explain why internode infestation rate, less easy to determine in practice, is sometimes simply predicted with stalk infestation rate. As reported by several researchers [27,41], such strong and positive genotypic correlations indicate that selection based on single stalk weight, internode number and millable stalk number could lead to improvement in agro-morphological traits like stalk diameter, stalk height and yield traits. In contrast, the millable stalk number per plot was negatively and strongly correlated to single stalk weight and average stalk diameter (r=-0.77 to -0.99).
Phenotypic and Genotypic coefficient of variation (PCV,GCV).
As stated by Sivasubramanian and Menon [41] cited by different investigators [14,22,42,43], PCV and GCV values are ranked as low, medium and high with 0 to 10 %, 11 to 20% and higher than 20% respectively (Tables 6&7). In plant cane, all PCV and GCV values determined which ranged respectively from 3.4 to 42.1% and from 2.6 to 17.8%, varied from low to moderate or high. As reported by different authors [44,45], high GCV and PCV indicated that selection might be effective on traits investigated and their expression be relevant to the genotypic potential. No agronomic trait exhibited high GCV estimates in plant cane. Moderate GCV values were associated to traits like millable stalk number, sugar yield, stem borer infestations (%BIN), single cane weight and recoverable sucrose with values ranging from 12.4 to 16.8%, might respond favorably to selection in line of findings reported by Ebid et al [27].
In first ratoon crop, all PCV and GCV values determined which ranged respectively from 2.8 to 33.6%, and from 2.2 to 20.5%, varied from low to high. Particularly, stalk internode infestation which exhibited a relatively high GCV estimate (20.5%), might respond favorably to selection in line of findings reported by Ebid et al [27]. Regardless the trait considered in both crop cycles, the phenotypic coefficient of variation was higher than the genotypic one, suggesting that apparent variations were not only due to genetics but also to environmental influences. However, differences between PCV and GCV for most traits were small in line of observations made by different investigators [22,46,47], indicating high prospects for genetic progress through selection under conditions of this study.
Phenotypic and Genotypic coefficient of variation (PCV,GCV).
In both crop cycles, phenotypic variance data obtained were higher than the genotypic ones regardless the trait considered. This shows a greater influence of environment on genetic variations in line of observations made by different authors [14,27,41]. Moreover, except for average single stalk weight and average single stalk height observed in plant cane, genotypic variance data regarding all traits calculated, regardless crop cycle, were higher than environmental ones suggesting important variations among genotypes. Therefore, agro-morphological traits with higher genotypic variance data observed in both crop cycles like cane yield and millable stalk number/ha, suggested high variations among genotypes.
Heritability and genetic advance
Estimates of broad-sense heritability (h²) are categorized according to Robinson [48] cited by different authors [14,39,41] as low (<30%), moderate (30≤-<60%) or high (≥60%). Higher heritability values ranging from 64 to 99% in plant cane and from 60 to 98%, in first ratoon crop, were observed on traits like millable stalk number, fiber content, average single stalk height, juice sucrose, sucrose content, and recoverable sucrose (Tables 6&7). In contrast, lower values (10-19%) were observed in plant cane for traits like stem borer infestation rates (%BI, %BC) and internode number. Moderate values of heritability were obtained over both crop cycles for average single stalk weight with 52 and 38% in plant cane and first ratoon, respectively. Estimates of mean genetic advance (GAM) are categorized similarly to GCV and PGV according to Falconer and Mackay [21] cited by several authors [41,42,46-48].
Therefore, over both crop cycles higher values of genetic advance were observed for sugar yield and millable stalk number. In addition to both later traits, higher values were exclusively observed on recoverable sucrose and internode infestation rate respectively in plant cane and first ratoon. Over both crop cycles, lower values were recorded on juice purity and cane infestation rate. In addition to both later traits, lower values were exclusively observed on number of internodes and average stalk diameter, respectively in plant cane and first ratoon. Higher values of GAM suggest that a significant proportion of the total variance might be heritable, and selection of corresponding traits would be effective. Similar values were reported by several authors in sugarcane on single stalk weight [27,49,50].
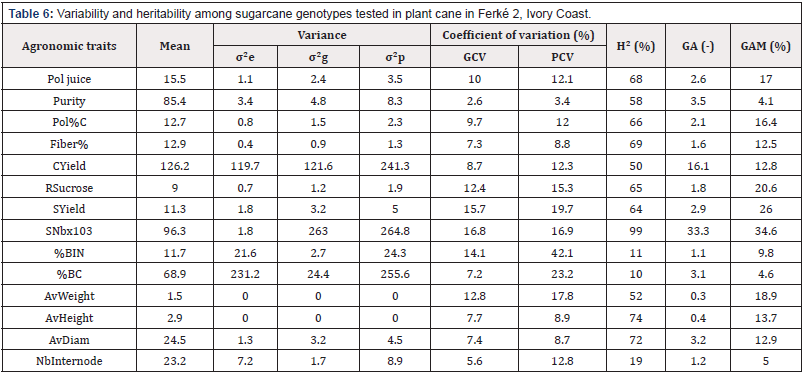
Table 6: Variability and heritability among sugarcane genotypes tested in plant cane in Ferké 2, Ivory Coast.
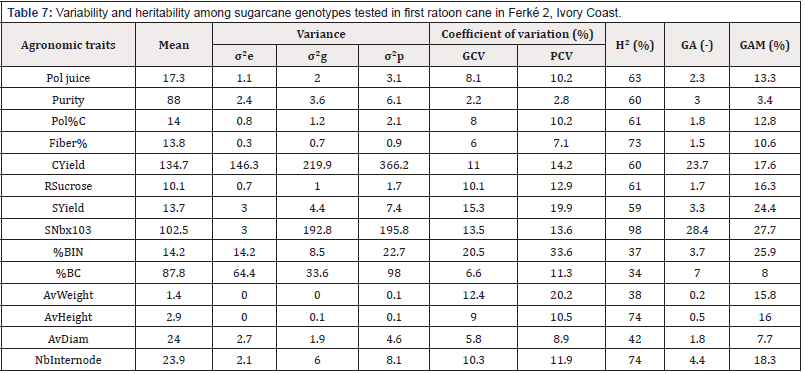
Table 7: Variability and heritability among sugarcane genotypes tested in first ratoon cane in Ferké 2, Ivory Coast.
As indicated by Vidya et al. [51], knowledge of variability and heritability of characters is essential for identifying those relevant to genetic improvement through selection. Moreover, the effectiveness of selection will depend not only on heritability but also on genetic advance [52,53]. Higher levels of mean genetic advance observed for sugar yields, millable stalk number, recoverable sucrose content and internode infestation rate were the result of moderate or high broad sense heritability combined with high GCV for these traits in line of findings reported by Bakshi [54]. According to this author, heritability estimates together with expected genetic gain were more useful than heritability values alone in predicting the effects of selecting best genotypes.
Chaudhary [31] also reported high heritability and genetic gain for single cane weight followed by number of millable cane in a study of 36 clones indicating substantial scope for cane yield improvement. On the other hand, sucrose content recorded low heritability and genetic gain suggesting little scope for improvement in this character [55]. Patel et al [56] also reported high heritability estimates for single cane weight, number of< internodes, tiller number, hand refractometer brix, cane diameter and millable cane length, which were associated with moderate to high genetic advance (23-190%). Findings indicated that these characters might be improved through selection. From the literature, findings on heritability, genetic gain, PCV and GCV for the same traits look sometimes controversial depending on locations, crop cycle (plant cane or ratoon), soil types, water regime (rainfed or irrigated), etc. [19,37,38,57,58]. But still, this is all about the scope of experimentation in agronomy, findings being mostly sitespecific.
Conclusions
The study showed that based on sugar yields, six genotypes higher or equivalent to check varieties used, namely N47, R95-2202, ECU01, R97-0391, N49 and CP98-1029, were found promising for the next and final advanced selection stage, with respectively 20.3, 16.5, 15.2 , 14.2, 13.3 and 13.3 t sugar/ha. Their cane yield performances ranged from 115.8 to 160.8 t/ha compared to 160.4 and 134.0 for the check varieties R579 and SP70-1006, respectively. Not only sugar yield, but also, recoverable sucrose, cane internode infestation rate and number of tillers per hectare were found as the most relevant agro-morphological traits in the genetic variation of sugarcane genotypes tested in line of their higher broad sense heritability values.
References
- Dahlquist E (2013) Biomass as Energy source: Resources, Systems and Applications, CRC Press Taylor & Francis England.
- Goldemberg J (2008) The Brazilian biofuels industry. Biotechnol Biofuels 1(1): 6.
- Waclawovsky AJ, Sato PM, Lembke CG, Moore PH, Souza GM, et al. (2010) Sugarcane for bioenergy production: An assessment of yield and regulation of sucrose content. Plant Biotechnol J 8(3): 263-276.
- Altpeter F, Karan R (2018) Genetic improvement of sugarcane by transgenic, intragenic and genome editing technologies. In: Achieving sustainable cultivation of sugarcane: Breeding, pests and diseases. Ph Rott eds, 2: 133-154.
- FAO (2014) FAO STAT, FAO statistical databases.
- Jackson PA (2005) Breeding for improved sugar content in sugarcane. Field Crops Research 92(2-3): 277-290.
- Yang X, Kandel R, Song J, You Q, Wang J, et al. (2018) Sugarcane genome sequencing and genetic mapping. In: Achieving sustainable cultivation of sugarcane. Breeding, pests and diseases. Ph Rot teds volume 2, USA.
- Wei X, Jackson P, Cox M, Stringer J (2006) Maximizing economic benefits to the whole sugarcane industry from BSES-CSIRO sugarcane improvement program. In: Proc Aust Soc Sugarcane Technol 28: 181.
- Khan IA, Dahot MU, Seema N, Yasmin S, Bibi S, et al. (2009) Genetic variability in sugarcane plantlets developed through in vitro mutagenesis. Pak J Bot 41(1): 153-166.
- Ali A, Khan SA, Farid A, Khan A, Khan SM, et al. (2017) Assessment of sugarcane genotypes for cane yield. Sarhad J Agric 33(4): 668-673.
- Péné CB, Ouattara HM, Koulibaly GS (2012) Late season sugarcane performance as affected by soil water regime at the yield formation stage on commercial farms in northern Ivory Coast. International Journal of Biological and Chemical Sciences 6(6): 644-651.
- Konan EA, Péné CB, Dick E (2017) Main factors determining the yield of sugarcane plantations on Ferralsols in Ferké 2 sugar complex, Northern Ivory Coast. J Emerg Trends Engin Appl Sci JETEAS 2017a: 8(6): 244- 256.
- Konan EA, Péné CB, Dick E (2017) Caractérisation agro-climatique du périmètre sucrier de Ferké 2 au Nord de la Côte d’Ivoire. Journal of Applied Biosciences. 116: 11532-11545.
- Tadesse F, Negi T, Getaneh A, Dilnesaw Z, Ayele N, et al. (2014) Genetic variability and heritability of ten exotic sugarcane genotypes at Wonji sugar estate of Ethiopia. Global Advanced Research Journal of Physical and Applied Sciences 3(4): 1-4.
- Hoarau M (1970) La canne à sucre. Le technician d’agriculture tropicale. Maisonneuve et Larose (eds)165 p.
- Hugot E, Sucrerie de canne Paris (1999) Collection Tech & Doc Lavoisier (eds.), pp. 1018.
- Péné CB, Kouamé KD, Dove H, Boua BM (2016) Incidence des infestations du foreur de tiges Eldana saccharina W (Lepidoptera: Pyralidae) en culture irriguée de canne à sucre selon la variété et la période de récolte en Côte d’Ivoire. Journal of Applied Biosciences 102: 9687-9698.
- Burton GW, Devane EH (1953) Estimating heritability in tall Fescue (Festuca arundinacea) from replicated clonal materials. Agron J 45: 487-488.
- Shitahum A, Feyissa T, Abera D (2018) Performances evaluation of advanced sugarcane genotypes (Cirad 2013) at Metahara sugar estate, Ethiopia. International Journal of Advanced Research in Biological Sciences 5(1): 91-104.
- Singh RK, Chaundary BD (1977) Biometrical methods in quantitative genetics analysis. Kalyani Publishers 57-58.
- Falconer DS (1996) Introduction to quantitative genetics. (4th edn) Longman Publishers, Harmlow, England.
- Jackson P, Basnayake J, Inman-Bamber G, Lakshmanan P, Natarajan S, et al. (2015) Genetic variation in transpiration efficiency and relationships between whole plant and leaf gas exchange measurements in Saccharum spp. And related germplasm. J Exp Bot 67(3): 861-871.
- Rebettzke GJ, Condon AG, Richards RA, Farquhar GD (2002) Selection of carbon isotope discrimination increases aerial biomass and grain yield of rainfed bread wheat. Crop Sci 42(3): 739-745.
- Esayas T, Firew M, Amsalu A, (2016) Heritability and correlation among sugarcane (Saccharum spp.) yield and some agronomic and sugar quality traits in Ethiopia. American Journal of Plant Sciences 7(10): 1453- 1477.
- Kang MS, Miller JD, Tai PYP (1983) Genotypic and phenotypic path analyses and heritability in sugarcane. Crop Sci 23: 643-647.
- Dagar P, Pahuja SK, Kaian SP, Singh (2002) Evaluation of phenotypic variability in sugarcane using principal factor analysis. Ind J Sugarc Technol 17: 95-100.
- Ebid MHM, Khalil HA, Abd-ElAal AM, Fergany MA (2015) Heritability and genotypic and phenotypic correlations among sugarcane yield and some agronomic traits. Egypt L Plant Breed 19(1): 159-171.
- Hallauer AR, Miranda JB (1988) Quantitative genetics in maize breeding. Iowa State Univ press, Ames lowa, p. 468.
- Falconer DS (1989) Introduction to quantitative genetics. (3rd edition) p. 430 UK.
- Ram B, Hemaprabha G (1992) Genetic variability in interspecific progenies in sugarcane (Saccharuim spp.). Ind J Genet.: 52(2): 192-198.
- Chaudhary RR (2001) Genetic variability and heritability in sugarcane. Nepal Agric Res J 4: 56-59.
- Kimbeng CA, Rattey AR, Hetherington M (2002) Interpretation and implications of GxE interactions in advanced stage sugarcane selection trials in central Queensland. Aust J AgricRes 53(9): 1035-1045.
- Parfitt RC (2000) Genotype x environment interaction among secondary variety trials in the northern region of the South African sugar industry. Proc S Afr Sug Technol Assoc 74: 245-258.
- Glaz B, Kang MS (2008) Location contributions determined via GGE biplot analysis of multi-environment sugarcane genotype-performance trials. Crop Sci 48: 941-950.
- Gomez KA, Gomez AA (1984) Statistical procedure for agricultural research (2nd edition) John Wiley and Sons Inc, USA.
- Gravois KA, Milligan SB (1992) Genetic relationship between fibger and sugarcane yield components. Crop Sci 32(1): 62-67.
- Tena E, Ayana A, Mekbib F (2016) Heritability and correlation among sugarcane yields and some agronomic and sugar quality traits in Ethiopia. Am J Pant Sci 7(10): 1453-1477.
- Béhou YYM, Péné CB (2019) Genetic variability and heritability among sugarcane genotypes in plant crop for some agronomic traits under tropical dry climate of Ferké, Ivory Coast. Journal of Experimental Agriculture International 38(1): 1-14.
- Dumont T, Thong-Chane A, Barau L, Siegmund B, Hoarau, et al. (2019) Genetic variability and genetic gains for yield components in regional sugarcane breeding program on Reunion Island. Sugar Tech pp.1-11.
- Péné CB, Boua BM, Coulibaly-Ouattara Y, Goebel FR (2019) Stem borer (Eldana saccharina W) infestation outbreak in Sugarcane plantations of northern Ivory Coast: Management strategies under implementation. American Journal of Bioscience and Bioengineering 6(4): 27-35.
- Shivasubramanian S, Menon M (1973) Heterosis and inbreeding depression in rice. Madras Agric J 60: 1139.
- Mancini MC, Leite DC, Perecin D (2012) Characterization of the genetic variability of a sugarcane commercial cross through yield components and quality parameters. Sugar Tech 14(2): 119-125.
- Li C (2017) Genotypic variations in transpiration efficiency due to differences in photosynthetic capacity among sugarcane-related clones. J Exp Bot 68(9): 2377-2385.
- Singh RK, Singh DN, Singh SK, Singh HN (1994) Genetic variability and correlation studies in foreign commercial hybrids of sugarcane. Agric Sci Dig 14: 103-107.
- Dos Santos Silva PP, Soussa M, De Oliveira EJ (2019) Prediction models and selection of agronomic and physiological traits for tolerance to water deficit in cassava. Euphytica 215(4): 73.
- Ram B (2005) Estimation of genetic parameters in different environments and their implications in sugarcane breeding. In J Genet 52(2): 192-198.
- Fartek B, Nibouche S, Atiama-Nurbel T, Reynaud B, Costet L, et al. (2014) Genotypic variability of sugarcane resistance to aphid Melanaphis sacchari, vector of the Sugarcane Yellow Leaf Virus. Plant Breeding 133(6): 771-776.
- Robinson HF (1966) Quantitative genetics in relation to breeding of the centennial of mendalism. Indian J Gen 26: 171-187.
- Teklu DH, Kebede SA, Gebremichael DE (2014) Assessment of genetic variability, genetic advance, correlation and path analysis for morphological traits in sesame genotypes. Asian Journal of Agricultural Research 8(4): 181-194.
- Nair NV, Somarajan KG, Baasundaram (1980) Genetic variability, heritability and genetic advance in Saccharum officinarum. Int Sugar J 82(981): 275-276.
- Singh GP, Maurya KR, Prasad B, Singh AK (1994) Genetic variability in Capsicum annum. L J Appl Biol 4: 19-22.
- Vidya KL, Oommen SK, Vijayaraghava K (2002) Genetic variability and heritability of yield and related characters in yard-long bean. Journal of Tropical Agriculture 40: 11-13
- Butterfield MK, Nuss KJ Prospects for new varieties in the medium to long term: The effects of current and future breeding strategy on variety characteristics.
- Shoba D, Manivannan N, Vindhiyavarman P (2009) Studies on variability, heritability and genetic advance in groundnut (Arachis hypogea L). Electronic Journal of Plant Breeding 1(1): 74-77.
- Bakshi R (2005) Estimation of genetic parameters in different environments and their implications in sugarcane breeding. Indian J Gen 65(3): 219-220.
- Pandey RA (1989) Variability study in the hybrid progenies of sugarcane (Saccharum complex). Bharatiya Sugar 49-51.
- Patel MM, Patel HS, Patel AD, Patel MP (2008) Correlation and path analysis in sugarcane. Ind Sugar 31: 911-914.
- Tefera A, Sentayehu A, Leta T (2017) Genetic variability, heritability and genetic advance for yield and its related traits in rainfed lowland rice (Oriza sativa L) genotypes at Fogera and Pawe, Ethiopia. Adv in Crop Science and Technology 5(2): 1000272.


 We use cookies to ensure you get the best experience on our website.