Mini-Review 
![]() Creative Commons, CC-BY
Creative Commons, CC-BY
Head Injury Criterion: Mini Review
*Corresponding author: G Virzi Mariotti, Engineering Department, Palermo University, Italy.
Received: September 23, 2019;Published: October 16, 2019
DOI: 10.34297/AJBSR.2019.05.000957
Mini Review
DHead Injury Criterion (HIC) is the most important parameter in terms of human survival; it is indicative of brain injuries due to the impact of the head in numerous cases, with a vehicle. This index can be estimated by integrating the resulting acceleration of the head (measured in its gravity center) in a time window according to the following definition:
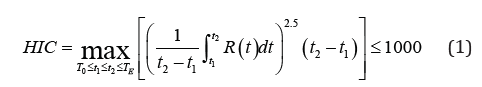
Where:
a) R (t) is the resulting acceleration, in g, measured in the gravity center of the head;
b) T0 the simulation start time in seconds;
c) TE the simulation end time in seconds;
d) t1 and t2 represent respectively the initial and final instant of a time interval, expressed in seconds, during which the HIC assumes the maximum value; the width of this interval is conventionally equal to 36ms [1].
The optimization is done by varying t1 and t2, i.e. the initial and final instant. In addition to the HIC36 there is the identically defined HIC15 with t2 - t1 = 15ms [2]. The 36ms interval is designed to understand the maximum load for impact waveforms that last longer than 36ms. The analysis of probability of injury of both HIC15 and 36 shows that the former is more restrictive. The severity indices do not provide a direct interpretation of the injury; moreover, they are defined with respect to different physical domains. For this reason, various mappings are developed to translate a scale severity index of Abbreviated Injury Scale (AIS). The NHTSA specified criteria for converting the values of HIC to the probability of injury p(AIS ≥ i) with i between 1 and 6. Since Euro NCAP [3] is based on the definition of the risk level of injuries mainly on the p level (AIS ≥ 3) (or, that is the same. AIS3+), the corresponding function is shown in relationship 2, where: Φ indicates the normal cumulative distribution, the mean μ = 7.45231 and the standard deviation σ = 0.73998.
For p (AIS ≥ 2) HIC36 and (AIS ≥ 4) HIC36 the numerical values are μ = 6.96352, σ = 0.84664 and μ = 7.65605, σ = 0.6058 respectively [1,4,5] (Figure 1).

Figure 1: Conversion criteria by equation 2.
p(AIS3+) HIC36 = φ ((ln (HIC36)-μ)/σ) (2)
A recent NHTSA research [7] on injury improvement criteria, includes the review of existing regulations, and specifies a HIC for the 50th percentile of male ATD (Anthropomorphic Test Devices). Beginning in 2000, the NHTSA final rule adopts limits that reduce the maximum time to calculate the HIC to 15 milliseconds (HIC15) compared to the previous HIC36 and the revision of the limits for different sizes of dummies fixing in 700 the threshold value of HIC15. The structure of the head for the whole family of dummies used in FMVSS 208 [8] is essentially a rigid padded aluminum shell that does not deform as the human skull deforms under load. The amount and type of deformation in the human skull, due to a load, varies significantly with age and with marked difference between very young children and adults [9]. The value of the HIC can be linked to a level of injury of the AIS scale. However, one can note that there are no unified and universally recognized conversion factors. Some studies, including those conducted in [10], try to link the acceleration of the head to the probability that this can be fatal to humans or do not cause injury. The result of the work consists of a table where the probability of injuries of different entities, defined according to the levels of the AIS scale, is highlighted (Table 1). More recently the expressions that determine the probability of AIS + injury (between 1 and 6) in function of the HIC were derived [11] in the case of an adult eliminating the cumulative distribution function.

Table 1: Head injury on AIS scale
Calculating the HIC value over the 36ms interval, the correlation equations for AIS3 + and AIS4 +, are [12]:
p(AIS3+) = 1/ [1+exp((3,39+200/HIC36)-0.00372*HIC36)] (3)
p(AIS4+) = 1/ [1+exp((4,90+200/HIC36)-0.00351*HIC36)] (4)
Calculating HIC value over 15ms, correlation equations are:
p(AIS3+) = 1/ [1+exp((3,39+140/HIC15)-0.00531*HIC15)] (5)
p(AIS4+) = 1/ [1+exp((4,90+140/HIC15)-0.00501*HIC15)] (6)
These equations are substantially derived by the curve proposed by Prasad and Mertz [2] expressed in a sigmoid form; one can assume that they give a better approximation than the relationship Figure 2 shows the trend of the probability curve in the case AIS4 + as a function of the value of HIC; the probability of AIS4 + is about 17% for HIC36 = 1000 or HIC15 = 700 and 5% for HIC36 = 650 or HIC15 = 400. It increases to 55% for HIC36 = 1500 or HIC15 = 1100 (about).

Figure 2: Trend of the probability curve versus the HIC value by relationship (3-6).
References
- Schmitt KU, Niederer PF, Muser MH, Walz F (2007) Trauma Biomechanics: Accidental injury in traffic and sports. Springer, London.
- Prasad P, Mertz HJ, Dalmotas DJ, Augenstein JS, Digges K (2010) Evaluation of the Field Relevance of Several Injury Risk Functions. Stapp Car Crash Journal 54: 49-72.
- (1998) EEVC/CEVE-European Experimental Vehicles Committee, EEVC Working Group 17 Report Improved Test Methods to Evaluate Pedestrian Protection Afforded by Passenger Cars.
- Haddadin S (2014) Towards Safe Robots-Approaching Asimov's 1st Springer Tracts in Advanced Robotics pp. 1-343.
- Kuppa S (2004) Injury criteria for side impact dummies. NHTSA.
- (2004) NTBRC/NHTSA, Injury Criteria for Side Impact Dummies.
- (1997) NHTSA. Actions to reduce the adverse effects of air bags. FMVSS No. 208.
- Mc Henry BG (2004) Head injury criterion and the ATB. ATB Users’ Group p. 2-8.
- Hertz E (1993) A note on the Head Injury Criteria (HIC) as a predictor of the risk of skull fracture. 37th Annual Proceedings of the Association for the Advancement of Automotive Medicine p. 73-80.
- Piano L (2009) La sicurezza passiva degli autoveicoli. Hoepli, Milano pp. 380.
- Golfo S, Virzì Mariotti G, Carollo F, Argo A, Barbaraci G (2019) Safety considerations on teenage pedestrian-bus impact. Proceedings of the Institution of Mechanical Engineers, Part D: Journal of Automobile Engineering.


 We use cookies to ensure you get the best experience on our website.