Research Article 
![]() Creative Commons, CC-BY
Creative Commons, CC-BY
On The Relative Potency of Ossame Supplement on Blood Sugar Level of Albino Rats
*Corresponding author: Obubu Maxwell, Department of Statistics, Nnamdi Azikiwe University, Awka, Nigeria.
Received: September 19, 2019;Published: October 14, 2019
DOI: 10.34297/AJBSR.2019.05.000952
Abstract
The effect ofAframomum Melegueta on glucose level was investigated in male albino rats. The rats were induced with Aloxan and the glucose levels were monitored for 24hours. In order to determine the effect Aframomum Melegueta, the rats were induced with 0.01mg/kg and 0.1mg/kg of both the test and standard preparation. The change in glucose level was recorded. The relative potency (p) is defined as the ratio of a dose of the test preparation to such a dose of the standard preparation that produces the same average response. The mean square for preparations in this assay was very large compares to the mean square for error. This large difference in mean responses will decrease the precision of potency estimation. The estimated relative potency R = 0.00 was contrary to p > 0.
Keywords: Relative potency;Aframomum Melegueta extract; Albino rats; dose; standard preparation
Introduction
The blood sugar concentration is the amount of glucose present in the blood of human or animal. The body naturally regulates blood glucose levels as part of metabolic homeostasis. With some exceptions, glucose is the primary source of energy for the body’s cell and blood lipoids (in the form of fats and oils) are primarily a compact energy store. Glucose is transported from the intestine or liver to body cells via the blood stream and is made available for cell absorption via the hormone insulin. Glucose level are usually lowest in the morning before the first meal of the day (termed the fasting level) and rise after meals for an hour or two by a few millimolar. Blood sugar levels outside the normal range may be an indication of medical condition. A persistently high level is referred to as hyperglycemia, while low levels are referred to hyperglycemia. Grain of paradise (Aframomum Melegueta) also known as Guinea pepper or Alligator pepper is a member of the Zingiberaceae family native to West Africa. It is an herbaceous perennial plant that grows up to 1.5 meters height, with purple flowers that develop into 5 or 7 cm long pods containing small, reddish-brown aromatic and pungent seeds. The stem at times can be short and usually shows signs of scars and fallen leaves. The fruits contain numerous, small, golden red-brown seeds. The seeds are used in West Africa as a remedy for variety of ailments such as stomachache, snake bite; diarrhea and they have reported anti-inflammatory properties.
Materials-and-Methods
In this study we used 42 male albino rats for the experiment, and they were divided into 4 groups
1) Group 1 (treatment group): Aloxan (a drug that raise the glucose levels of rats) was induced into 12 rats assigned in this group and after they received treatment only from the test preparation
2) Group 2 (standard treatment): Aloxan was induced into these group, they were later treated using the standard preparation only.
3) Group 3 (diabetic control): The animals here were induced with Aloxan, none of the treatment was given to them.
4) Group 4 (control): there were 6 animals in this group, none of them received a treatment of either standard or test preparation and Aloxan was not induced in them
There were 2 doses used in his assay (0.1mg/kg and 0.01mg/ kg). The animals in group 1 to 3 were further divided into 3 groups. The first 6 in group 1 received 0.01mg/kg of the test preparation and the remaining 6 received 0.1mg/kg. Also, the first 6 in group 2 received 0.01mg/kg of the test preparation remaining 6 received 0.1mg/kg of the standard preparation. The weights of the animals inall the groups were first ascertain before and after inducing Alloxan into the animals, also their glucose level was measured before and after the induction. The glucose levels were being checked to know when it will raise to 100mg/kg and above. The standard treatment was given to groups 2 and the test preparation to group 1. After this induction their glucose levels were checked again after 24 hours. The study employed the use of biological assay. Biological assay is routinely used to estimate what is commonly known as the relative strength of a standard drug to that of one or more experimental drug. In this study we used parallels line assay (the symmetrical -point design) which is technique under indirect assays based upon quantitative response. A parallel line assay in which each of the preparations has an equal number of doses and an equal number of subjects is allotted to each of the doses, is called a symmetrical parallel line assay.
We shall discuss here only symmetrical parallel line assays. Let the number of doses of each of the preparations be . As there are in all 2k doses in this assay, it is called a 2k - pint symmetrical parallel line assay or simply 2k-point assay. Let n subjects be allotted to each of the doses and a suitable response be measured from each subject. The analysis of the assay for conducting validity tests and for estimating relative potency becomes very much simplified when the doses of each of the preparations are taken in geometric progression shown below
S, cs, c2s…ck-1s and t, c2 t, ck-1 t
Where s and t are suitable starting doses of the standard and test preparation respectively and is a constant which is the same for both the preparation.
Assumptions/Validity of the Assay
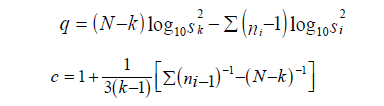
Homoscedasticity: the error sum of square comprises contributions from each of the doses. This may be examined separately in order to discover whether there is any evidence of heteroscedasticity. Bartlett’s test is used to test for homogeneity of variance.
Where,
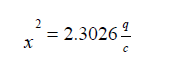
with K-1 degree of freedom
And,
Linearity: the means squares for linearity or deviations from linearity should be examined. The difference in preparation: Unlike an ordinary experiment for the comparison of different treatments, no direct interest attaches to the mean difference in response between the two preparations. Nevertheless, a large mean square for this component is an indication that the assay is not very satisfactory.
Parallelism: If other test had disclosed no significantly large mean square for linearity or preparation, a large mean square for the component based on deviations from parallelism would indicate fundamental invalidity of the assay
Regression: In any good assay, the mean square for regression ought to be relatively large. If there were no regression, the dose response relationship could be of no use for the estimation of potency
Potency Estimation
The relative potency is the ratio of the 2 doses that express the
biological activity of a sample preparation compared to a standard
preparation. Let ZS and Z t denote the doses of the standard and test
preparation respectively, such that each of them produces a preassigned
response in some living organism. Then  is called
the relative potency of the rest preparation.
is called
the relative potency of the rest preparation. it shows that
a smaller dose of the test preparation produce as much response
as the relatively larger dose of the standard preparation and
hence potency of the test preparation is greater than that of the
standard preparation.If
it shows that
a smaller dose of the test preparation produce as much response
as the relatively larger dose of the standard preparation and
hence potency of the test preparation is greater than that of the
standard preparation.If it shows that the potency of the test
preparation is smaller than that of the standard preparation
it shows that the potency of the test
preparation is smaller than that of the standard preparation
Results

Table 1:Response of the Blood sugar level of the rats.

Table 2:ANOVA.
Remarks: ANOVA was used to check the mean difference in preparation, regression, parallelism, doses and error
Preparation: The F-ratio for this was 16.42 compared to the table value of 4.35. This shows that the assay was not satisfactory. This throws a serious warning but will not lead to the rejection of the assay.
Parallelism: A large mean square for the component based on deviations from parallelism would indicate fundamental invalidity of the assay. The F-ratio=0.02 and the table value is we therefore accept that the assay is parallel.
Regression: if there were no regression, the dose-response relationship could be of no use for the estimate of potency. The F-ratio= 0.39 and the table value is 4.35, we therefore believe in the existence of regression.
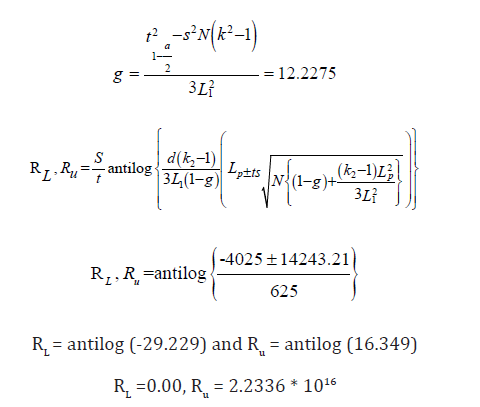
The relative potency estimator (R) was computed to be 0.00 (Table 3).

Table 3:Heterogeneity of the data
Homoscedasticity: The Bartlett’s test was used to test for homogeneity of variance. The test shows that the data is homogeneous. The difference in the total responses for the two preparations is;
The Fiducial limits are as follows;
Conclusion
The estimated relative potency indicates that nothing can be said about the relative potency of the new preparation at used dose levels, as a result of this, the assay is invalid. This problem could have been avoided if; there were improvements in the choice of doses of the test preparation, the experimenter should make sure that the doses of the test preparation chosen is almost equal in effect to the corresponding doses of the standard preparation, and if the range of the average responses of the test preparation should not be wider than that of the standard preparation.
References
- Djira GB (2010) Relative potency estimation in parallel line assay s – Method Comparison and Some Extensions. Taylor and Francis group 39.
- Inegbenebor U1, Ebomoyi MI, Onyia KA, Amadi K, Aigbiremolen AE (2009) Effect of aqueous extract of Alligator pepper (Zingiberaceae aframomum melegueta) on gestational weight gain. Niger J Physiol Sci 24(2): 165-169.
- Finney DJ (1952) Statistical analysis in biological assay. Charles griffin and company, London


 We use cookies to ensure you get the best experience on our website.