Research Article 
![]() Creative Commons, CC-BY
Creative Commons, CC-BY
Impact of Fertilizer Subsidy Programme on Maize Income in the Northern Region of Ghana
*Corresponding author: Samuel Safo K Allotey, Department of Agricultural Extension, Rural Development and Gender Studies, University for Development Studies, Tamale, Ghana.
Received: October 30, 2019; Published: November 12, 2019
DOI: 10.34297/AJBSR.2019.06.001010
Abstract
This study principally assessed the impact of fertilizer subsidy programme on maize income in the Northern Region. Sample sizes of 400 respondents were interviewed using questionnaires. Secondary data was also collected for the study and the results analyzed. Simple random sampling techniques was used in selecting respondents. The data was analyzed using appropriate descriptive statistics and Propensity Score Matching (PSM). The study revealed that majority of smallholder participated in the fertilizer subsidy programme. High level of participation in the fertilizer subsidy programme among smallholder farmers can be partly due to high poverty level in Northern region of Ghana. In establishing the relationship between smallholder farmers’ participation in fertilizer subsidy programme and maize income. The propensity scores matching results revealed a significant effect between smallholder farmers’ participation in the fertilizer subsidy programme and maize income of participants. The study calls for more investment and expansion of the subsidy Programme to other agricultural inputs such as improve seed, pesticides and insecticides as the subsidy have the ability of increasing smallholder income levels.
Keywords: Fertilizer Subsidies; Maize Income; Participation
Introduction
The agricultural sector contributes nearly one-fifth of the Ghana’s Gross Domestic Product (GDP) and provide employment for almost half of the country’s labour force. More so, the sector serves as a main source of livelihood for the poorest households in the country [1,2]. Agricultural sector is expected to play a lead role in the long-term sustainable growth and development of Ghana economy. Notwithstanding the rapid increased in minerals, oil and gas sector which affected the relative contribution of the agricultural sector of Ghana GDP in recent times [3] agriculture remains important in employment and income generation and livelihood enhancement among the rural poor [4]. An estimated figure of 45 percent of the national work force is been employed in agricultural sector, exceeding any other sector of the economy [5]. The agriculture sector is essential to the livelihoods of the country’s poorest households and as such play a role in poverty reduction. Ghana’s agricultural sector is dominated by smallholder farmers who hold small portion of lands scattered across rural areas in Ghana [6].
These smallholder farmers cultivate on an average of 1.5 hector farmland size and characterized by low usage of advanced agricultural technologies [7]. Most of these smallholder farmers, farm yields are usually low as compared to achievable yields [8]. Lower fertilizer usage, couple with poor soil fertility management results to poor crop yields. Unfortunately, most of these smallholder farmers in Ghana barely survived on less than US$2 a day and so are unable to afford the high prices of chemical fertilizer in right quantities and qualities (MoFA, 2016). In providing for this short fall, government and other development partners supported farmers with inputs subsidies to boost smallholder farmers’ production [9]. Because of economic crisis and fiscal space concerns across Africa in the late 1970s and early 1980s, the World Bank (WB) and International Monetary Fund (IMF) initiated national economic recovery and structural adjustment programme and trade liberalization programme. This national economic recovery and structural adjustment programme encouraged private sector led development and deregulation of the fertilizer market.
The aim of the national economic recovery and structural adjustment programme was to forced government across Africa in removing all agricultural subsidies on the continent [10-12]. The removal of fertilizer subsidies greatly affected crop yield negatively and wellbeing of the rural poor [13,14]. In view of the green revolution, fertilizer subsidy programmed raised the use of chemical fertilizer by farmers and resulted in increased agricultural productivity to about fifty percent (50%) of yield growth [15]. To increase fertilizer usage among farmers, the first ever African summit on chemical fertilizer policy which took in Abuja, Federal Republic of Nigeria on the theme “Fertilizer for African Green Revolution the Abuja Declaration”.
This conference mandated African-Union Member States to resolve in increasing farmers’ access to fertilizer on time as well as increase fertilizer usage to about 50 kilogram per hector before 2015 [16]. To achieve this resolution, some measures were put in place by member state, these measures included, the removal of import levies and charges on chemical fertilizer and materials used for manufacturing of chemical fertilizer. The reintroduction of subsidized chemical fertilizer by member state, subsidization of chemical fertilizer was to make it easily accessible and available at all time for farming activities by smallholder farmers. Also, the African leaders were required to continuously devote 10 percent of their annual budget to invest in agriculture [16]. This was to ensure increase fertilizer usage by smallholder farmers and enhanced livelihood of her citizens [17]. The Abuja Declaration aimed at increasing public investment in agriculture and increasing farmers’ access to fertilizer for the green revolution of Africa have been rectified and adopted by many countries and implemented with some positive upward trends in fertilizer use in SSA [16]. Also, in June 2014 Heads of State from Africa met in Malabo, Equatorial Guinea, with the emphasis on improving agricultural productivity and food security through addressing the challenges that hindered the growth of the agricultural sector. This resulted in the Malabo Declaration on “Accelerated Agricultural Growth and Transformation for Shared Prosperity and Improved Livelihoods” [18].
Following this declaration, in July 2008 the government of Ghana started a national wide voucher-based fertilizer program on some types of chemical fertilizer, namely; urea, sulphate of ammonia and NPK. The implementation of this programme was an attempt in offsetting the rising energy and food prices at the time (MoFA, 2009). This subsidized fertilizer programme was to address a significant increase in the prices of food and fertilizer worldwide (MoFA, 2008). Also, government identified low fertilizer usage among farmers in Ghana as compared to other countries in Sub- Sahara Africa, smallholder farmers’ uses an average of 8 kg/ha, leading to poor crop yield, high prices of food as well as low income level of farmers (MoFA, 2009). The subsidized fertilizer programme was then seen as a key in addressing the several problems farmers faced in the country. This fertilizer subsidy programme directly aim at achieving increasing application rate of fertilizer from existing rate of 8kg to an average of 20 kg per hectare by farmers [19]. When this objective is achieved, it will improve crop yields and agricultural productivity among smallholder farmers as well as raise the profitability of farm production and enhancing the income level of farmers [20]. Maize is part of the crops supported by fertilizer subsidy programme in Ghana, maize is a major staple crop used as a substitute for other major cereals that are in short supply during the lean season (MOFA, 2016). This has resulted in an increase in demand of maize for both domestic and industrial purposes [1]. The high demand of maize in Ghana for both domestic and industrial purposes have led to a radical approach in increasing production of maize through the provision of improved technologies and subsidy policy [21]. Supporting farmers with subsidized fertilizer can result in massive increase in maize yields and ultimately bring improvement in crop income [22]. It is in this light, that this study seeks to establish the influence of fertilizer subsidy programme on maize income among smallholder maize farmers in the Northern Region of Ghana.
Methodology
The study was carried out in the Northern Region of Ghana. Primary data on the influence of fertilizer subsidy programme on maize income in the Northern Region was collected using questionnaire and key informant interviews (among maize farmers) to 400 respondents. Secondary data was also obtained from records of MOFA as well as reviews of journals and library materials. The survey employed simple random sampling techniques in selecting the sample for the study, in selecting the districts for the study, simple random sampling techniques was employed and seven (7) districts out of 17 districts in the Northern Region were selected. From each sample district, simple random sampling techniques was employed to select 57 respondents. Data was analysed using frequencies, percentage and Propensity Score Matching (PSM).
Measuring Crop Income
Crop Income is computed below:
Y1 = (Quantity of produced harvested per acre * Market price of crop) …………… (1)
This study will limit farmers to an average income obtain within farming calendar year, express in GH₵.
Random Utility Theory (RUT)
Following Random Utility Theory (RUT) a farmer’s decision to participate fertilizer subsidy programme can be analyzed within a random utility framework. The outcome variable (total crops income per acre of the farmer) is considered as a linear function of binary variable for fertilizer subsidy programme participation along with a vector of some other explanatory variables (X):
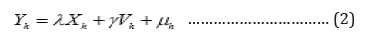
Where Yh is the outcome variable, Vh is a binary variable for participation in the fertilizer subsidy Programme, λ and γ are vectors of parameters to be estimated and μ is the error term. However, from Equation 2, since γ measures the impact of participation in the fertilizer subsidy Programme (treatment variable) on total crop income per acre (outcome variable), then, farmers should be randomly assigned to the group of participants or non-participants. However, the subsidy Programme is rarely randomly assigned. Though, participation in the subsidy Programme usually leads to self-selection based on intended benefits. In other words, it translates the fact that in Equation 2, μ is correlated with V or Z. Equation 2 which does not consider the self-selection and might lead to a biased estimation. The PSM is employed in this study in order to deal with selection bias.
Propensity Score Matching (PSM)
In analyzing the impact of smallholder farmers’ participation in fertilizer subsidy programme on crop income, the method of matching based on propensity scores is applied. Analyzing the impact of social interventions, it requires the establishment of the requisite counterfactual that represents what would have happened had their intervention not taken place or what otherwise would been true [23].
The establishment of this counterfactual often poses problems where before intervention situation remains missing. Under such circumstances appropriate estimation of the counterfactual is established by way of a comparative group that does not participate in the intervention. In social interventions where participants were selected purposively rather than at random, the problem of ‘’selection bias’’ is often encountered in evaluation of impact. Therefore, analysis of the impact based on a ‘’with and without’’ approach yields inaccurate results [24] and any attempt to net out actual intervention impact must factor in the underlying selection process [12].
The case of fertilizer subsidy programme is universal in nature. Based on the participation strategy in the fertilizer subsidy programme, the PSM framework is used for estimating the impact of the fertilizer subsidy programme on smallholder farmers’ crop income. Impact through this outcome variable is obtained by matching an ideal comparative groups (non-participants farmers) to the treatment group (participants farmers) based on propensity scores (P-scores) of X. X is the set of observable characteristics that determine participation in fertilizer subsidy programme. By so doing the selectivity bias is greatly eliminated.
To develop the PSM framework, let Yi be the outcome variable of a smallholder farmer I, such that Y1i and Y0i represent smallholder farmer outcome with and without participation to fertilizer subsidy programme respectively. A dummy variable Ii represent participation in fertilizer subsidy programme by smallholder farmer I, where Ii = 1 if the smallholder farmer has participated fertilizer subsidy programme and I0 = 0, otherwise. The outcome observed for smallholder farmer i, Yi is defined by the switching regression (Quandt, 1972).

The impact of fertilizer subsidy Programme on smallholder farmers’ crop income is given by;

Where ΔiYi represents the change in the outcome variable of smallholder farmer I, resulting from participation in fertilizer subsidy Programme. A smallholder farmer cannot be both ways, therefore, at any time, either Y1i (participant farmers) or Y0i (nonparticipant farmers) is observed for that smallholder farmer. This gives rise to the selectivity bias problem [25]. The framework assumes heterogeneity in impact of outcomes. The heterogeneity assumption is important because, practically all households
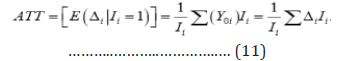
This gives rise to the selectivity bias problem [25]. The framework assumes heterogeneity in impacts of outcomes. The heterogeneity assumption is important because, practically all smallholder farmer who participate in fertilizer subsidy Programme cannot benefit equally as a result of differing characteristics. The most commonly used evaluation parameters are averages [25]. The two means are common in the impact analysis framework effects, (ATE) and the average treatment effect on treated (ATT). In the case of fertilizer subsidy programme, ATE estimates the effects of smallholder farmers’ participation fertilizer subsidy programme on crop income of the whole population without regard to only participants in fertilizer subsidy programme but the ATT estimated smallholder farmers participation in fertilizer subsidy programme effects conditional on smallholder farmers’ participation in fertilizer subsidy programme. It is the latter which this study seeks to estimate, and it is represented as:

From equation (5), E [Y0i / Ii=1] is the missing data representing the outcomes of smallholder farmers’ participation in fertilizer subsidy programme in the absence of the subsidy. One way to estimate the missing data is to use outcomes of a non-participant group. By using the outcomes of a non-participation farmers, (5) can be rewritten as:

Without controlling for the unobservable heterogeneity, (6) can be shown to consist of a bias in addition to the impact estimate.Subtracting and adding E [Y0i / Ii=1] to the right-hand side of (6) gives;
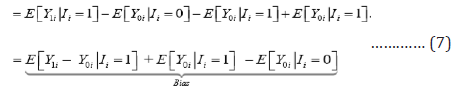
Rearranging (7) gives;

Thus, a bias of the magnitude shown in (8) results when nonparticipant farmers are selected for comparison with participant farmers, without controlling for the non-random fertilizer subsidy programme assignment [26]. The PSM method takes care of the bias, so that estimated participation impact is largely consistent. The method identifies and matches smallholder farmers within the smallholder farmers’ participation that are similar in observable characteristics’ Xi, to those of non-participants farmers. This done by deriving propensity scores from a binary logit estimation of fertilizer subsidy programme participation model [27]. A binary logit model can be represented as;

Where X is a vector of explanatory variable including farmers’ demographic characteristics which are deemed to influence participation in fertilizer subsidy programme; Pr (X) is the propensity scores.
Based on the propensity scores of participants and nonparticipants farmers, the nearest neighbor matching and Kernel matching methods are used to select the best non- participants farmers for the subsidy programme. [28] noted that, since exact matching is rarely possible, an issue of closeness must be considered. Matching therefore uses the expected outcomes of the participants’ farmers (participation in fertilizer subsidy programme), conditional on the propensity scores to estimate the expected counterfactual of the non- participants’ farmers [26]. Thus, the relation holds, only when the assumption of closeness of propensity scores is valid (common support assumption).

The ‘‘conditional independence’’ or ‘‘exogeneity’’ assumption must hold for this relation be true. [26] revealed that once appropriate common support is established the conditional impendence assumption becomes valid. They proved that, if outcomes without participation (Y0i) are independent of participation in fertilizer subsidy programme (Ii) given Xi = x, the participants are also independent of participation (Ii) given their propensity scores [P(X)]. In PSM fertilizer subsidy participation characteristics are used to estimate a single value (P-score) which serve as the basis of comparison rather than the characteristics themselves. The latter could be very laborious; hence PSM solves the ‘‘curse of dimensionality’’. Once common support is established for the participants, the heterogeneity impact (ATT) of the fertilizer subsidy programme on crop income can then be estimated using (10).
Nearest Neighbor Matching (NNM)
A case in the control group is matched to treated case based on the closest propensity score. Each person in the treatment group choose individual(s) with the closest propensity score to them. The radius matching is using not only the closest nearest neighbor within each caliper, but all the individuals in the control group within the caliper [29-30].
Kernel Based Matching (KBM)
The KBM uses weight averages of all cases in the control group to estimate counterfactual outcomes. The weight is calculated by the propensity score distance between a treatment case and all control cases. The closest control cases are given the greatest weight. Each farmer in the treatment group is matched to a weighted sum of individuals who have similar propensity with greatest weight being given to farmers with closer scores.
Results and Discussion
Maize Farmer’s Participation in the Fertilizer Subsidy Programme
Under this study participation is when a farmer buys the fertilizer at a subsidized price, non-participation is when a farmer buys at commercial market price. However, in the case of the subsidy programme, it is universal in nature and every farmer has the chance of participating or not. From Table 1, the results revealed that, those who participated in the fertiliser at the subsidised rate among farmers constitute 259 (64.8%) while the remaining 141 (35.3%) did not participate in subsidised fertiliser rate. The high level of participation among farmers can partly be due to the lower cost involves in securing subsidized fertilizer as compared to commercial rates. According [8], farmers in developing countries usually preferred agricultural input to be subsidized for easy accessibility, due to their poor economic status (Table 1).

Table 1:Frequency distribution of Participation in the Fertilizer Subsidy Programme.
Source: Field Survey Data, 2019
Estimation of Treatment Effect: Matching Algorithms
In other to assess the causal effect of smallholder farmers participation in fertilizer subsidy programme on crop income, one outcome variable was used; thus, crop income. Here the ATT was estimated using the nearest neighbor and kernel matching algorithms. Table 2 presents results from the PSM model that was estimated for comparison purposes with the treatment effect model results. The propensity scores matching results indicates that smallholder farmers participation in the fertilizer programme had a significant impact on crop income among participants. Participants’ crop income is found to between GH₵ 1468.89 and GH₵ 1469.63 more than non-participants based on the matching method used. Here two matching indicators, the nearest neighbor and the kernel based matching algorithms were used as robustness checks (Table 2). The Nearest Neighbor matching method identified 143 comparable control smallholder farmers, while the Kernel matching method identified 145 control smallholder farmers from the non-participants.

Table 2:Matching methods to measure Impact of participation in fertilizer subsidy Programme on crop income.
Note: *** significant at 1%, ** significant at 5% and * significant at 10% of significance levels.
Source: Field Survey Data, 2019
The average income estimated using the Kernel matching algorithms is slightly higher than that of the Nearest Neighbor matching algorithms, indicating that the Kernel matching algorithms is somewhat conservative. Thus, both matching methods indicate that smallholder farmers’ participation in fertilizer subsidy programme play an important role in increasing crop income in the area. Comparing the results across the different matching methods indicate that the estimated fertilizer subsidy impact is robust. The results imply that participants get between GH₵ 1468.89 and GH₵ 1469.63 more than the non- participants’ farmers depending on the matching method used. This is consistent with the findings of [20]. This indicates that participation in fertilizer subsidy programme has led to significant increase in crop income. As smallholder farmers will have extra income if their crops are sold.

Figure 1: Density Distribution of Propensity Scores Using Nearest Neighbor.

Figure 2:Density Distribution of Propensity Scores Using Kerel Matching
Figure 1 and 2 show a visual presentation of density distributions of the estimated propensity scores for the two groups. These histograms illustrate the number of smallholder farmers’ who are on fertilizer subsidy programme support and those off support. The common support condition is satisfied. There is an overlap in the distribution of the propensity score of both participants (treated) group and non- participants (untreated) group. The upper halves of the histograms show the propensity score distribution for the participants while the bottom halves refer to that of the nonparticipants [31-33] (Figure 1&2s).
Conclusion
The fertilizer subsidy programme in Ghana is universal and open to all smallholder farmers have option to either participate or not. However, as a result high cost of fertilizer in the country, most smallholder farmers prefers to patronize subsidized fertilizer than fertilizer from open market. It is evident that majority of smallholder in the study area participated in the fertilizer subsidy programme. The high level of participation in the fertilizer subsidy programme among smallholder farmers can partly be due to high poverty level in Northern region of Ghana. Thus, this is not surprising that a lot of smallholder farmers in the area participated in the programme. In establishing the relationship between smallholder farmers’ participation in fertilizer subsidy programme and maize income. The propensity scores matching results revealed a significant effect between smallholder farmers’ participation in the fertilizer programme and maize income of participants. Smallholder farmers who participated in the fertilizer subsidy programme had’ an average income of GH₵ 1468.89 and GH₵ 1469.63 more than non-participants as indicated by the propensity scores matching. Based on these finding, this study calls for more investment and expansion of the subsidy programme to other agricultural inputs such as improve seed, pesticides and insecticides. Since, the subsidy programme has the ability of increasing smallholder income levels.
References
- Andam KS, Johnson ME, Ragasa C, Kufoalor DS, Das Gupta S (2017) A chicken and maize situation: The poultry feed sector in Ghana (1601) Intl Food Policy Res Inst.
- Dovie DBK, Kasei, RA (2018) Hydro-climatic stress, shallow groundwater wells and coping in Ghana's White Volta basin. Sci Total Environ 636(15): 1268-1278.
- Quandt RE (1973) "A New Approach to Estimating Switching Regressions". Journal of the American Statistical Association 67: 306-310.
- Djanibekov U, Gaur V (2018) Nexus of energy use, agricultural production, employment and incomes among rural households in Uttar Pradesh. India Energy Policy 113: 439-453.
- Oduro AD, Doss CR (2018) Changing patterns of wealth distribution: Evidence from Ghana. The Journal of Development Studies 54(5): 933-948.
- Amadou ML, Villamor GB & Kyei-Baffour N (2018) Simulating agricultural land-use adaptation decisions to climate change: An empirical agent-based modelling in northern Ghana. Agricultural Systems.
- Chamberlin J (2008) It's Small World After All: Defining Smallholder Agriculture in Ghana. Intl Food Policy Res Inst (823).
- Shively GE, Ricker-Gilbert J (2013) Measuring the Impacts of Agricultural Input Subsidies in Sub-Saharan Africa: Evidence from Malawi's Farm Input Subsidy Program. Purdue Policy Research Institute (PPRI) Policy Briefs 1(1): 4.
- Amanor KS, Chichava S (2016) South–south cooperation, agribusiness, and African agricultural development: Brazil and China in Ghana and Mozambique. World Development 81: 13-23.
- Havnevik K, Bryceson D, Birgegård LE, Matondi P, Beyene A (2007) African agriculture and the World Bank: development or impoverishment? Nordiska Afrikainstitutet.
- Union A (2006) Abuja declaration on fertilizer for the African green revolution. African Union Special Summit of the Heads of State and Government, Abuja, Nigeria (13).
- Zaman H (2001) Assessing the poverty and vulnerablity impact of micro credit in Bangladesh: A case study of BRAC. Office of the chief economist and senior vice president (DECVP). The World Bank pp. 34-36.
- Chibwana C, Fisher M, Jumbe C, Masters WA, Shively G (2010) Measuring the Impacts of Malawi's farm input subsidy program. African Journal of Agriculture and Resource Economics 9(2): 132-147.
- MoFA (2007) Agriculture in Ghana – Facts and Figures (2006) Statistics, Research and Information Directorate (SRID)
- Mittal A (2009) The 2008 food price crisis: rethinking food security policies. UN.
- Union A (2017) Technical Guidelines for Preparing Country Biennial Review Report on Progress Made for Achieving the Malabo Declaration Goals and Targets. Addis Ababa: AU.
- Crawford EW, Jayne TS, Kelly VA (2005) Alternative approaches for promoting fertilizer use in Africa, with emphasis on the role of subsidies (1095-2016-88224).
- Whitehead A (2009) The gendered impacts of liberalization policies on African agricultural economies and rural livelihoods. In The gendered impacts of liberalization (pp. 53-78).
- Ragasa C, Chapoto A (2017) Moving in the right direction? The role of price subsidies in fertilizer use and maize productivity in Ghana. Food security 9(2): 329-353.
- Jayne TS, Rashid S (2013) Input subsidy programs in sub-Saharan Africa: a synthesis of recent evidence. Agricultural economics 44(6): 547-562.
- Houssou N, Kolavalli S, Silver J (2016) Agricultural intensification, technology adoption, and institutions in Ghana. Intl Food Policy Res Inst 48(10): 153-167.
- Ricker-Gilbert J, Jayne TS, Chirwa E (2011) Subsidies and crowding out: A double-hurdle model of fertilizer demand in Malawi. American journal of agricultural economics 93(1): 26-42.
- Baker JL (2000) Evaluating the Impact of Development Projects on Poverty: A Handbook for Practitioners. The World Bank, Washington, US pp. 1-65.
- Friedlander D, Robins PK (1995) Evaluating Program Evaluations: New Evidence on Commonly Used Non-experimental Methods. American Economic Review 85: 923-937.
- Heckman J, Ichimura H, Todd P (1997) “Matching as an Econometric Evaluation Estimator: Evidence from Evaluating a Job Training Programme”. The Review of Economic Studies 64(4): 605-654.
- Cobb-Clark D, & Crossley T (2003) "Econometrics for Evaluations: An Introduction to Recent Development". The Economic Record 79(247): 491-511.
- Dehejia RH, Wahba S (2002) Propensity score-matching methods for nonexperimental causal studies. The Review of Economics and Statistics 84: 151-161.
- Rosenbaum PR, Rubin DB (1985) Constructing a Control Group Using Multivariate Matched Sampling Methods that Incorporate the Propensity Score. The American Statistician 39: 33-38.
- Mason NM, Jayne TS, Mofya‐Mukuka R (2013) Zambia's input subsidy programs. Agricultural Economics 44(6): 613-628.
- Mittal A (2009) The 2008 food price crisis: rethinking food security policies. UN MOFA (2010) Implementation guidelines for 2010 Fertilizer Subsidy Programme. Ministry of Food and Agriculture (MOFA), Accra, Ghana.
- MoFA (2015) Agriculture in Ghana – Facts and Figures (2014)” Statistics, Research and Information Directorate (SRID).
- Salifu H, Salifu K (2015) Determinants of farmers’ adoption of improved maize varieties in the Wa Municipality. American International Journal of Contemporary Research 5(4): 27-35.
- Skarstein R (2005) Economic liberalization and smallholder productivity in Tanzania. From promised success to real failure, 1985–1998. Journal of Agrarian Change 5(3): 334-362.


 We use cookies to ensure you get the best experience on our website.