Mini Review 
 Creative Commons, CC-BY
New Optical Tools for Spectral Diagnostics of Liquid Solutions
*Corresponding author: Ferdenant A Mkrtchyan, Kotelnikov Institute of Radio Engineering and Electronics, Russian Academy of Sciences, Russia.
Received: May 05, 2020; Published: May 29, 2020
DOI: 10.34297/AJBSR.2020.09.001351
Abstract
Three new optical devices has been design and constructed for the operative diagnostics of medical, biological and water solutions using state-of-the–art technology of optical inverse tasks solution in wavelength range from 350nm to 780nm. The structures of optical devices have the elements for the assessment of optical properties of liqueds and software for the concentration evaluation of chemicals in the solutions. One of the functions optical devices is recognition of solutions to define their classes using a database of spectral standards. The using optical devices in the expedition conditions in the hard-to-reach regions when there no exists chemical laboratory for operative analysis can be unique possibility to know a solution quality. One of such situations is mission to Mars. This paper represents results of optical diagnostics of the water objects in South Vietnam and Siberia when the water quality of these objects is assessed and their optical spectral images are formed. Measurement procedure is described to be as the instruction for each of three optical devices operation.
Keywords: Liquid Solution; Spectrophotometer; Spectroellipsometer; Optical Specter; Software; Algorithm; Inverse Task
Introduction
Optical tools were used for the diagnostics of the water quality for different reservoirs in many countries [1-6]. These tools are based on the devices of spectrophotometry and spectroellipsometry [7-9]. Spectrophotometric devices deliver one spectrum that reflects of spectral optical properties for liquid solution a knowledge of which allows the accurate interpretation of measured reflection and attenuation spectra in terms of chemicals concentrations. Spectroellipsometric devices deliver two spectrums that show polarized optical properties of liquid solutions basing on the registration of optical polarization effects appearing under reflection or deformation of the light wave as a result of its interaction with studied object. In the solid physics, Spectrophotometry and Spectroellipsometry gives possibility to measure simultaneously amplitude and phase characteristics of studied object and allows the precise definition of the film thickness and optical constants for film material. The diagnostics of liquids gives possibility to assess the concentration of chemicals dissolved and weighed in the liquid, as well as to determine the spots of pollutants on the liquid surface. Kovalev et al. [7,8] developed the spectroellipsometry with binary modulation of polarization state. It is based on the elements of polarization optics and allows the measurement within wide spectrum. Optical devices proposed by Kovalev et al. [7,8] have not moving polarization elements. They were used in framework of hydrochemical investigations in South Vietnam for the diagnostics of different water objects including rivers, basins for fish industry and aquatories of South-China Sea [2,9]. These investigations have shown astonishing responsiveness and reliability of measurement data a mathematical analysis of which allows the assessment of water chemical characteristics. Really it is needed to solve multi-channel inverse task when spectrophotometric and spectroellipsometric data are interpreted as the concentrations of chemical substances in the solution sample [6-9]. Certainly, optical measurements are characterized by stability of spectral images.
Method
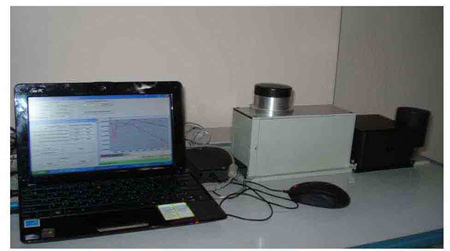
Photometers and refractometers are widely used to study the optical properties of liquids in various fields of science and technology. As a rule, the accuracy of determining the refractive index and absorption coefficient is significantly related to the degree of collimation and the intensity of the radiation beams. Thus, in [8], the measurement of n (refractive index) with an accuracy of 0.0001 is ensured by using two tunable lasers at eight discrete wavelengths in the visible range and an angular goniometric device. Abbe standard refractometers have an accuracy of measuring n for distilled water up to 0.0005 at fixed wavelengths. The need to measure low concentrations of water pollution requires that the relatively thick layers be scanned when measuring the absorption coefficient. Good collimation of beams and high signal-to-noise ratio provide LED light sources. Kovalev et al. [7,8] developed and manufactured a constructively simple automatic photometerrefractometer with high metrological capabilities, which uses a set of 8 LEDs with peak radiation wavelengths from 350 nm to 780nm. As final result, a new adaptive spectrophotometer-refractometer decision making system (ASRDMS) was synthesized to have a general view represented in Figures 1&2 shows general view of adaptive universal spectrophotometer decision making system (AUSDMS). (Figure 3) represents adaptive spectroellipsometric decision making system (ASEDMS). When the ASRDMS and AUSDMS are used, optical parameter n as function of wavelength λ allows the system of equations n(λ)=f(c1,…,cm) where ci (i=1,…, m) are chemical elements concentration. As shown by Krapivin et al. [5,6] for solutions with small concentration a linear function f provides precision of optical inverse task solution no less 99.8±0.2 percents. A using the ASEDMS as measuring device allows the simultaneously two spectra that reflect the ellipsometric angles Δ (0°-360°) and Ψ (0°-90°) where Δ is the phase difference before and after the reflection (phase shift); angle Ψ corresponds to the amplitude ratio during reflection. The functional representation of cosΔ and tanΨ is defined by the ratio of complex Fresnel coefficients [10].
The ASEDMS delivers two spectra SΨ(λ) and SΔ(λ) an analysis of which allows the assessment of physical and chemical properties of studied liquid solution. Precision of these assessments depend on the using software [6].
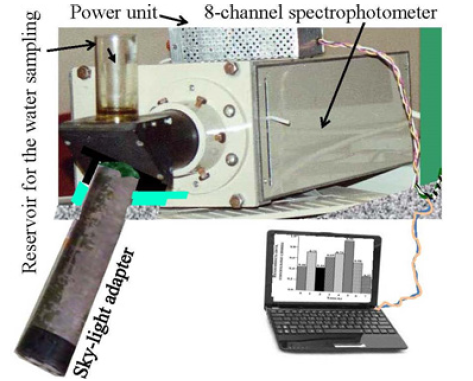
Figure 2: General view of the 8-channels adaptive universal spectrophotometeric decision making system (AUSDMS) with universal functions that allow the measurements both in situ without liquid solution sampling and under this action.
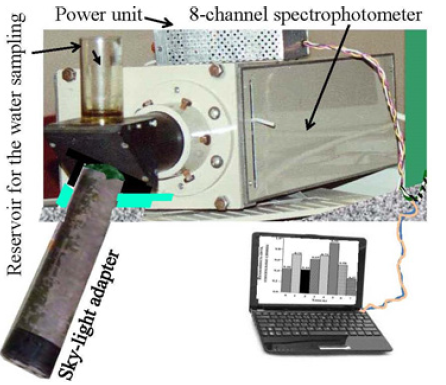
Figure 3: General view of 35-channels adaptive spectroellipsometric decision making system (ASEDMS).
Two main regimes of spectral measurements are possible:
a) The AUSDMS has possibility to measure optical specters both in-situ and in laboratory conditions when there exists liquid solution sample. Diagnostics of liquid solution in-situ regime is realized by the sky-light adapter sinking to the liquid.
b) The ASEDMS and ASRDMS can measure the optical specters only when liquid sample exists.
Results and Discussion
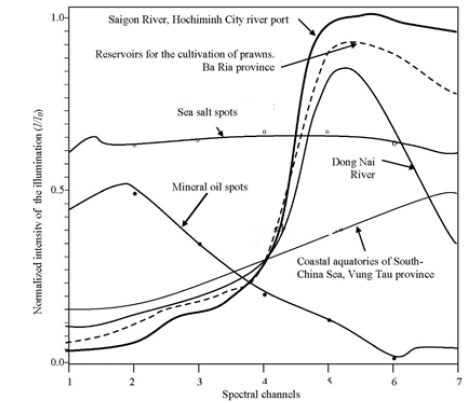
Figure 4: Molecular Mechanism of autophagy A) ELE increase the LC3I conversion to LC3II, as a result Beclin1 become activated, Atg5-atg12 complex become formed, LC3 punctate dots formation start and lead to autophagy in these cells. B) Pue which induces autophagy in through PI3K/Akt/ERK pathways via downregulation the phosphorylation of Akt and ERK, which was further inhibited by a PI3K/Akt inhibitor BEZ235. With further activation of PI3K/Akt pathways also increase the Atg5 activation but having no obvious effect on the conversion of LC3I to LC3II.
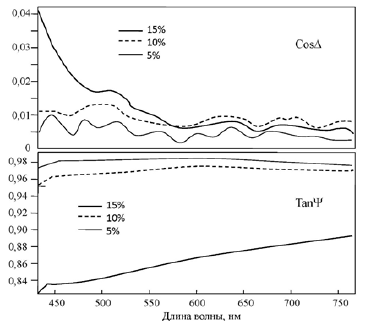
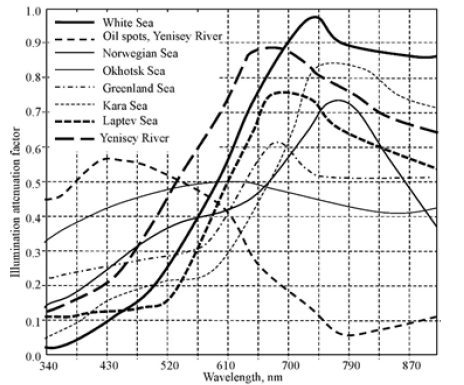
Figures 4 & 5 show results, when different water solutions were diagnosed. As it follows from these results the specters practically identically describe a specific solution reflecting its optical parameters. The wavelengths at which the metals can be detected are as follows [11]: Ca-318nm, Cr-268nm, Ba-234nm, Pb-220nm, Co and Cd-229nm, Mg-285nm, Cu-327nm, Mn-258nm, Fe-238 nm, Ni-231nm, Zn-206 nm, Ti-335nm. Direct detection of the metals and others chemicals, the ASRDMS realizes by means of optical inverse task solution using linear system of equations:

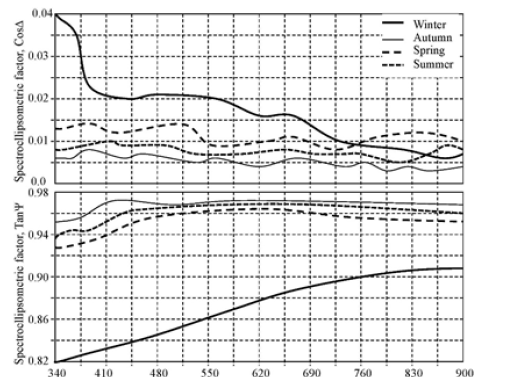
Figure 7: Spectroellipsometric spectral images of Kara Sea registered with 35-channel AI on the base of the sea water samples imitated with using literature and modeling data [12,13].

Table 1: Spectral standard of 10% solution of CuSO4. Notation: Ψ and Δ are spectroellipsometric angles.

Table 2: Concentration of pollutants in selected water objects reconstructed using their spectral images.
Coefficients {aij} are assessed during the ASRDMS training, when fully known liquid solution sample are studied. Really a decision concerning liquid solution quality can be made only on the base of its standard spectral image that was earlier prepared [12,13]. Example of such spectral digital standard is given in Table 1. The AUSDMS was used during 2000s for the diagnostics of different water objects of South Vietnam and Siberia to assess the risks of the missing critical concentration of the dangerous chemical elements in the water objects having significant role in the people life. Figure 4 represents spectral images of different water objects located in South Vietnam. Figure 6 shows spectral images of different water bodies of northern latitudes. Figure 7 characterizes the spectral changes of Kara Sea depending on the season. Table 2 shows some results of inverse task solution using software.
Conclusion
Three optical devices considered in this paper deal with operative diagnostics of the water reservoirs, chemical and biological solutions giving their hydrochemical state and providing the detection of extremely developing situations. These devices provide the collection and analysis of the data from multiple sources including in-situ measurements of the hydrochemical characteristics using optical tools [14]. The optical tools are based on the combined application of spectrophotometry and spectroelliposometry methods and algorithms of training, classification, and identification. The realization of this objective will require the combined use of engineering and algorithmic tools providing real - time measurements and data processing. A using the optical devices represented in this paper for the biological and medical liquid solutions is possible without additional investigations. The ASRDMS can form specters and measure concentration of chemical elements in the sampling solution. The AUSDMS provides both in-situ measurements without sampling and in the regime when solution sampling is used. The ASEDMS can measure the concentration of chemicals in in-situ when transmitter with array of LEDs and receiver of light flow are dropped to solution. The AUSDMS can realize measurements in the real time of moving regime when part of sky-light adapter is located below the liquid level.
Conflicts of Interest
The authors declare no conflict of interest. The funders had no role in the design of the study; in the collection, analyses or interpretation of data; in the writing of the manuscript, or in the decision to publish the results.
Acknowledgement
The reported study was funded by RFBR according to the research project № 19-07-00443-a.
References
- Varotsos CA, Krapivin, VF (2018) Pollution of arctic waters has reached a critical point: An innovative approach to this problem. Water, Air, & Soil Pollution 229(11): 1-14.
- Mkrtchyan FA, Krapivin VF, Kovalev VI, Klimov VV (2009) An adaptive spectroellipsometric technology for ecological monitoring of sea water. PICES Scientific Report 36: 215-218.
- Krapivin VF, Mkrtchyan FA (2014) Multichannel spectroellipsometric technology for aguatic environment diagnostic. Environment and Ecology Research 2(2): 91-96.
- Krapivin VF, Varotsos CA, Soldatov V Yu (2015) New Ecoinformatics Tools in Environmental Science: Applications and Decision-making. Springer, London 903.
- Krapivin VF, Mkrtchyan FA, Potapov II, Soldatov V Yu (2016) Information-modeling technology for the Nuoc Ngot Lagoon diagnostics on the Vietnam coast. Journal of Science and Technology, Binh Duong University 9(8): 38-48.
- Krapivin VF, Varotsos CA, Bui Quoc Nghia (2017) A modeling system for monitoring water quality in lagoons. Water, Air & Soil Pollution 397: 1-12.
- Kovalev VI, Rukovishnikov, AI, Kovalev SV, Kovalev VVA (2016) LED wideband spectral ellipsometer with switching of orthogonal polarization states. Optical Journal 83(3): 55-59
- Kovalev VI, Ali M, Kovalev SV, Kovalev VV (2014) Possibilities of coaxial asymmetric phaseshifters with an even number of reflections. and Spectr 117(1): 118-120.
- Mkrtchyan FA, Krapivin VF, Klimov VV (2015) An Adaptive spectroellipsometric technology for the diagnosis of water ecosystems. Proceedings PIERS 2015 in Prague 6-9: 199-202.
- Tompkins HG, Irene EA (2005) Handbook of ellipsometry. Springer Werlag Publisher 860.
- Vardanyan LG, Ingole BS (2006) Studies on heavy metal accumulation in aquatic acrophytes from Sevan (Armenia) and Carambolim (India) lake system. Environ Int 32(2): 208-218
- Krapivin VF, Varotsos, CA, Soldatov VY (2014) Mission to Mars. Reliable method for liquid solutions diagnostics. Frontiers in Environmental Science: Environmental Informatics. Sci 2(21).
- Krapivin VF, Varotsos CA, Christodoulakis J (2016) Mission to Mars: Adaptive identifier for the solution of inverse optical metrology tasks. An International Journal of Solar System Science: Earth, Moon and Planets, 119: 1-14.
- Varotsos CA, Krapivin VF (2017) A new big data approach based on geoecological information-modeling system. Big Earth Data 1(2): 47-63.



 We use cookies to ensure you get the best experience on our website.