Research Article 
![]() Creative Commons, CC-BY
Creative Commons, CC-BY
The Colloid Vibration Potential Effect from Silica Suspensions Using Electroacoustic Spectroscopy
*Corresponding author: Jafar Iqbal Khan and Mi Wang, School of Chemical and Process Engineering, University of Leeds, LS2 9JT Leeds, UK.
Received: May 29, 2020; Published: June 16, 2020
DOI: 10.34297/AJBSR.2020.09.001372
Abstract
Electroacoustic techniques are vital tools in order to characterize colloidal suspensions. When an acoustic wave is applied to a source of colloidal suspension, a vibration potential is generated as a result of the interaction. This particular responded potential is termed Colloid Vibration Potential (CVP) and is detected as an AC electrical signal. We address the physicochemical properties upon measuring the CVP for Silica Dioxide (SiO2) colloidal particles with three different concentrations of 0.5, 1 and 5% by wt., and a Particle Size Distribution (PSD) ranging from 35, 70, 100, 165 and 190nm. Our experimental technique has relatively eased access to the colloidal source and in addition provides an improved signal to noise ratio with implementation of a fully external detector to sense the generated responded signal. Current study provides relatively consistent measurements at three different excitation frequencies 0.5, 1 and 2MHz. Specifically, the high concentration (5%) of all samples with different particle size distribution enhanced the CVP signal magnitude, facilitating the highest value of 0.0378mA obtained for 100nm at 0.5MHz. The CVP increases initially as a function of the PSD but descends at a particle size > 100nm. Finally, for the case of the excitation frequency the CVP magnitude yields highest value at 0.5MHz.
Keywords: Electroacoustic, Colloids, Colloid Vibration Potential, Physicochemical, Vibration Potential, Silica Dioxide
Introduction
The concept of Ion Vibration Potential (IVP) by applying an ultrasonic wave to electrolytic ions has its origin back to Debye who initially predicted this phenomenon as a sound wave propagates through an electrolyte suspension [1]. The IVP will be generated because of the passage of the external acoustic wave interacting with the ionic source. This particular potential arises due to the difference in cations (negatively charged ions) and anions (positively charged ions) mass and in addition, it will accompany the applied ultrasound wave, having the same frequency but lag in phase. The generated potential can be detected either as a current, Ion Vibration Current (IVI) or Voltage (IVP) between two points in space. Herman’s and Rutgers extended this terminology to colloidal systems, and consequently, Yeager and Zana performed the first experimental work on silica suspensions [2-7]. Eventually, the term was more generalized to Colloid Vibration Potential (CVP). The relative signal magnitude of CVP is much stronger than IVP; typically, a factor of 20 and the value is in order of few hundreds of mV or few μA depending on measuring the desired voltage or current, both IVP and CVP are special cases of Ultrasound Vibration Potential (UVP).
CVP is the creation of an electric field caused be the applied ultrasonic field due to the displacement of the surface charged particles. Usually, charges are carried by the particle in a suspension, and it is surrounded by oppositely charged counter ions facilitating an overall neutrality of the entire suspension. A layer, known as the Double Layer (DL), contains the surrounding charge, which is spherically distributed surrounding the particles. The external ultrasonic force is categorized as being a pressure gradient force and displaces the charge carriers (the particle and counter ions) from their equilibrium position causing a polarization, which is treated as a charge-dipole. The time varying ultrasonic field results in a generated alternating electrical field, which is measured by two electrodes placed across the suspension.
Enderby and Booth conducted the first theoretical work associated with the CVP [8]. Subsequently, O’Brien followed a different approach and also described the inverse effect of Electro Sonic Amplitude (ESA) [9-19]. The modern understanding of CVP was established from the respective work of Shilov & Ohshima [20- 29]. With Dukhin & Goetz [30] linking both approaches and the current understanding of CVP applying both O’Brien’s, and Enderby and Booth’s modern theory to the experimental data [30-40]. The generated electric field is described by following equation [17]:
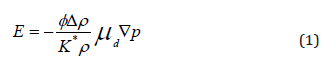
This is a key equation for understanding the vibration potential, it is stating that the generated local electric field is proportional to the pressure gradient force Δρ and the electrophoretic mobility. Here ϕ is the volume fraction of particles, ρ is the mass density of the suspension, Δρ is the density difference between the particles and the fluid, the parameter μd is the dynamic mobility of the particles and K* is the complex conductivity.
In this contribution, we demonstrate a new experimental measurement strategy by applying an external sensor to the colloidal source in order to detect the CVP signal magnitude fully outside the materials in the current mode. The addressed technique differs from commercial instrumentation such as described in literature, where the transducer is either immersed or contacted with the suspension [38], which relies on the fact that the generated signal is homogenous. Our technique is a step towards developing an imaging technique to be implemented in medical industry and it will require an external sensor located fully outside the body of interest. The measured quantities are in good agreement with existing theoretical predictions by Ohshima & O’Brien [39,40], in addition, indirect measurements using the ESA (Electro Sonic Amplitude) technique is also comparable to our findings. Recent experimental techniques demonstrated by Guan et al. & Schlaberg et al. [40,41] and Beveridge are all limited allowing the CVP signal to be detected at the boundary or within the colloidal source [41- 43].
Methodology
The experiments were conducted applying the Leeds standard II facility, described by Khan et al. [44] using three different transducers operating at 0.5, 1 and 2MHz central frequency respectively. The colloid vibration potential signal magnitude was detected for a selected group of silica dioxide suspensions consisting of five different principal particle size distributions of 35, 70, 100, 165 and 190 nanometres(nm) and each size with 3 different concentrations of 0.5% by weight (wt.), 1% by wt. and 5% by wt. The principle of detecting the CVP signal experimentally is similar as described for the case of IVP [44]. Further contribution has been made to the generation of the CVP signal [45]. In Figure 1 the schematics provides insights to the principle and mechanism of creation of the CVP effect. The arrows indicate the relative displacement of anions and cations upon action of an external ultrasonic wave, and as observed the former is displaced to a greater extent than the latter. The net result is that point A will have more negative potential and conversely point B more positive potential. By placing electrodes at two different terminals of the ultrasonic wave, the CVP signal magnitude is detected.

Figure 1: A schematic drawing illustrating the principle of generation of the CVP. The relative movement of anions and cations indicated by the arrows upon action of an external ultrasonic field. The points A and B yields the respective potential difference, where the actual CVP signal is detected.
Preparation of the selected material concentration is conducted through dilution of the principal solution since original silica dioxide particles are highly concentrated ranging from 10-20% by wt. The dilution process is carried out using Sodium Dodecyl Sulphate (SDS) solvent with a concentration of 0.05 % and distilled water. Once the suspension is prepared a typically volume of 35mL is added to the Perspex source chamber, the sample holder. Carefully the chamber is sealed using a cling film to avoid any leakage, and to prevent the surrounding water to immerse inside the sample chamber. The actual experimental method is similar to the one described in literature [44], and herein the 1MHz transducer is applied to the source of silica dioxide having a PSD of 35nm with 0.5 % concentration by weight. The operating frequency is set to 1MHz and the Colloid Vibration Potential Signal (CVP) is detected in the current mode by using the variable gain current amplifier with a gain of 104V/A. Analogously, the signal is detected for all 15 suspensions applying this 1MHz transducer. Afterwards, the two remaining transducers, operating at 0.5 and 2MHz central frequency, respectively, are introduced in similar fashion to obtain the CVP signal magnitude for all suspensions. The position of the external sensor is 1mm from the boundary of the source chamber and the resulting CVP signal magnitude is then recorded on the oscilloscope.
Results and Discussion
The obtained CVP magnitude results are addressed in three different parts corresponding to the three experimental parameters: the concentration of the suspension, the particle size distribution and the excitation frequency. The CVP signal is generated at the boundary of the solution and a typical measurement is presented in Figure 2. Both electrical pulses are comprised of 6 cycles, and they appear at the entrance and exit of the colloidal source at the respective cling film surfaces. Further information related to generation of the current is worked out in literature [46-48]. The excitation voltage of 9.9V peak to peak is read on the oscilloscope and a gain of 40dB provides an actual value of 990V.

Figure 2: Typically, waveforms obtained for Si 70nm colloidal suspension comprised of 6 cycles.
Effect of Concentration
The detected CVP magnitude results are displayed for five different silica dioxide colloidal suspensions with different principal particle size distribution 35, 70, 100, 165 and 190nm respectively for the case of 1MHz transducer in Figure 3, and the error bars are well presented ranging up to 5%. The CVP magnitude is measured by varying the particle concentration and the effect of it is strongly pronounced providing the smallest signal magnitude for a value of 0.5% and consequently the highest for 5%. The relative significant change in the signal strength is obtained for concentration higher than 1%. The CVP magnitude is clearly enhanced for higher concentration as reflected by the values for 5%. At lower concentrations in the range of 0.5-1% crossings occur between the values and are most likely due to signal-to-noise ratio linked to the actual measurements of the relatively ultra-weak signal. The CVP signal magnitude ranges in order of 0.35μA for the case of 190nm 0.5% providing the lowest signal and to 19.9μA for the case of 100nm 5% having the strongest signal. Similarities are observed for the case of the 0.5 and 2MHz transducers associated with the concentration.
At lower concentrations it is difficult to mirror the significant difference in the signal strength, for instance it is observed that silica 70nm provides strongest signal for the case of 2MHz transducer, reflecting inconsistency linked at lower concentrations. All measurements have a tolerance so possible errors are incorporated in measurements for low concentration such as 0.5 and 1%. Thus, the effect is enhanced for higher concentrations and is in good agreement with previous study reported in the literature [41]. It is appropriate to look at the conductivity effect since the CVP magnitude is inversely proportional to the conductivity. Conductivity increases as a function of the concentration and CVP is descending as a function of the conductivity but it turns out the concentration effect is more predominant compared to the conductivity as a result of the pronounced overall increment of the CVP magnitude. Our results are also quantitatively comparable to the measurements reported in the following report [38].

Figure 3: The CVP signal magnitude obtained using 1MHz transducer for five samples of silica dioxide suspensions with three different concentrations of 0.5, 1 and 5% by wt.
Effect of Particle Size Distribution
The effect of principal particle size distribution displays an interesting feature. The CVP magnitude increases from 35nm up to 100nm and surprisingly there is an abruptly change as the signal magnitude is significantly descending at particle size slightly greater than 100nm. The tendency is prominent for the case of 165nm and culminates at 190nm. At first sight, the origin of the unexpectedly and discontinuous behaviour is explained and identified in terms of the surface charge. Further observation indicates that at lower concentration (0.5%) the signal strength variation is not clearly pronounced and as discussed above potential errors are linked with the ultra-weak signal and incorporated within the measurements (Figure 4).

Figure 4: The CVP signal magnitude versus the particle size distribution measured using a 1MHz transducer.
For the case of the 0.5MHz transducer, the signal magnitude shows the expected behaviour for both the 5 and 0.5% wt. samples. The odd observation is present for the case of 1% wt. providing signal magnitude of 100nm lower than both 70 and 165nm and in addition, the latter size has the peak value of all samples. The offset is calculated with the difference being (0.008-0.005) mA = 0.003mA, which gives about 38%. It seems quite large but be aware that detecting these weak values are extreme challenging and the deviation can be large which is experienced during the actual measurements. For the case of 1MHz transducer, the results are relatively satisfying for both 1 and 5% concentrations. The remarkable situation is seen for a single point at 100nm for 0.5% concentration, which is slightly lower than the CVP magnitude for 70nm. Measurements obtained at an excitation frequency of 2MHz is to a large extent quite satisfying except for the case of 165nm that peaks for both 0.5% and 1% concentrations.
The main interpretation of the measurements is that the colloid vibration potential signal magnitude is descending for larger particle size distribution around 165nm. This observation is in good agreement with the findings reported earlier in literature, which points in direction of a decreasing signal magnitude for larger particle size distribution [41]. In that particular study the PSD range was different than in current case, however overall, the effect of PSD is clearly comparable despite the crossings are observed at lower concentrations. The fact is that surface charge plays a vital role in electroacoustic measurements. As the surface area increases the surface charge density becomes smaller, thus at a certain or critical PSD the colloid vibration potential signal drops. With this, we infer that the critical particle size range is 100-165nm and 190nm for our case. It is well documented that CVP signal magnitude increases from small particle size to larger particle size and then drops gradually for particle size greater than 165nm. This effect has been demonstrated using three different transducer frequencies thus providing a relative consistency throughout the measurements.
In order to evaluate the discontinuous behaviour, we consider the double layer for a spherical particle. The potential for a flat symmetric double layer is given in terms of the particle radius a, and it decays exponentially. The surface charge is a function of the Stern potential, which is frequency dependent of the concentration of a suspension. For large ka the surface charge is directly proportional to the Stern potential and thus the concentration. On the other hand, in the case of small ka it has a form, which is simultaneously proportional to the Stern Potential and inversely proportional to the particle radius. Thus, the relationship between surface charge and particle size is incorporated in this formalism. For relatively small PSD, in order of nanometres, the surface charge increases, and is proportional to the concentration. In contrast, as the particle size distribution is increased a deficit appears in surface charge. The discontinuity in the CVP signal magnitude is thus intuitively explained by this effect. Analogously the conductivity effect, as discussed for the case of different concentrations, is weaker compared to the particle size effect so the net result of increment in CVP magnitude is predominantly due to the latter.
Effect of Frequency
The data is also displayed for three different transducer frequencies for all samples in Figure 5, and additionally, an inset is presented to provide insights into the samples yielding lower signal magnitude. As it appears the frequency spectrum is relatively narrow across 0.5-2MHz due to the limitations of the equipment. Our measurements reflect that CVP magnitude is descending with the applied excitation frequency and few crossings occur for the case of 0.5 and 1% concentration. However, it is evident that CVP signal magnitude is enhanced at 0.5MHz and the sample with PSD 190nm exhibits the lowest signal. With this, we believe that most of crossings are due to measurement errors clearly indicated by the relative error bars. For the case of 5% concentration there is only one intersection point at 2MHz providing that 35 nm PSD has a higher signal strength than 70nm, this can be explained by errors incorporated in the actual measurements or aggregation taking place. The effect of CVP signal magnitude increasing with the concentration is more substantial for the data of 5% concentration as observed earlier. Nevertheless, the measured results are quantitatively in good agreement with the theoretical predictions by Dukhin & Ohshima, and in addition with O’Brien’s calculations for monodispersed and polydisperse particulate systems [32].

Figure 5: The CVP signal magnitude as a function of the transducer frequency displayed for all colloidal suspensions.
In the end, we discuss the effect of attenuation of the acoustic wave influencing the measurements. To this end, pioneering work has been conducted measuring ultrasound attenuation from several systems [38]. Attenuation of ultrasound is frequency dependent and for our case this is additionally linked to the measurement circuit associated with the transducer, current amplifier and of the electromagnetic field. Typically, attenuation at this relatively narrow frequency range (0.5-2MHz) is less than 0.1dB for Silica suspensions [38]. Further the attenuation linked to the transducer performance is less than 1dB and finally the attenuation gain from the frequency response of the current amplifier is 2dB in the particular frequency region. The total ultrasound attenuation associated with the CVP measurement is estimated to be 3.1dB. Additional factor causing attenuation of the high frequency electromagnetic field (or current density) inside conductive materials is also called the skin effect, which is frequency dependent.
However, due to the narrow frequency band, for example at a distance of 5mm away from the CVP generation, the current density ratio for the selected CVP signals at 2.0MHz and 0.5MHz is only about 0.99. Consequently, the obtained values provide the total attenuation caused by ultrasound and the measurement circuit of 3.1dB. Finally, having addressed both attenuation mechanisms and their impact, the relative CVP signal increment from 2MHz to 0.5MHz yields a factor of 2.5 for our experimental results This corresponds to a relative increase of 8dB thus it will play a dominant role in the frequency effect presented in Figure 5 compared to the attenuation of 3.1dB.
Conclusion
In summary, we have presented an experimentally electroacoustic technique to investigate the physicochemical properties of different silica suspensions. The measured CVP magnitude is increasing as a function of the colloidal suspension concentration ranging from 1% by wt. to 5%, where the effect is clearly pronounced for the latter case. The relative change in CVP magnitude for the case of 100nm providing the highest signal is a factor of 22.9 and the actual value for this particular PSD is obtained to be 19.9μA. Furthermore, the effect of the PSD on CVP has been investigated and it is evidenced that the magnitude is ascending at smaller PSD but suddenly descends at larger PSD around 110- 120nm. The relative change of the descending signal magnitude for this particular particle size distribution is from the peak value to the lowest value providing a difference of 10%. The discontinuous behaviour is explained by considering the surface charge, which decreases as a function of the particle radius at a certain value.
The overall lowest value of the CVP magnitude is detected for a PSD of 190nm with a value of 0.35μA. In addition, the CVP magnitude decreases as a function of the excitation frequency at a relatively narrow spectrum of 0.5-2MHz. The relative difference obtained for the case of 100nm is 40% so a pronounced effect is clearly observed. Attenuation is incorporated in our frequency response measurements and have a slightly higher value than the overall signal drop. As a matter of fact, we have examined three different parameters to investigate the outcome of silica suspensions and our results are relatively in good agreement with existing knowledge. The points emerged in current study can potentially serve for testing of different colloidal systems, in addition, further improvement will establish a pathway to a standard imaging technique to be utilised in medical science.
Acknowledgements
The authors would like to acknowledge the entire UVP team at University of Leeds, the funding source EPSRC and especially we are grateful to FUSO Chemical CO Limited for providing the silica particles in order to conduct the research.
References
- Debye P (1933) A Method for the Determination of the Mass of Electrolytic Ions. J Chem Phys 1(1): 13-16.
- Hermans J (1938) J Phil Mag 26: 674.
- Hermans J (1938) J Phil Mag (Series 7) 25: 426.
- Rutgers AJ, Rigole W (1958) Ultrasonic vibration potentials in colloidal solutions, in solutions of electrolytes and in pure liquids. Trans Faraday Soc 54: 139-143.
- Yeager E, Dietrick H, Hovorka F (1953) Ultrasonic Waves and Electrochemistry. II. Colloidal and Ionic Vibration Potentials. J Acoustical Soc America 25(3): 456.
- Yeager E, Bugosh J, Hovorka F, McCarthy J (1949) The Application of Ultrasonic to The Study of Electrolyte Solutions II the Detection of The Debye effect. J Chem Phys 17(4): 411-415.
- Zana R, Yeager E (1967) Ultrasonic Vibration Potentials and Their Use in The Determination of Ionic Partial Volumes. J Phys Chem 71(3): 521-536.
- Booth F, Enderby JA (1951) On Electrical Effects due to Sound Waves in Colloidal Suspensions. Proc Phys Soc 65(5): 321.
- O Brien RW (1988) Electro-acoustic Effects in a Dilute Suspension of Spherical Particles. J Fluid Mech 190: 71-86.
- O Brien RW (1990) The Electro-Acoustic Equations for a Colloidal Suspension. J Fluid Mech 212: 81-93.
- O Brien RW, Hunter RJ (1981) The Electrophoretic Mobility of Large Colloidal Particles. Can J Chem 59(13): 1878-1887.
- O Brien RW (1981) The Electrical Conductivity of a Dilute Suspension of Charged Particles. J Colloid Interface Sci 81(1): 234-248.
- O Brien RW, Cannon DW, Rowland WN (1995) Electroacoustic Determination of Particle Size and Zeta Potential. J Colloid Interface Sci 173(2): 406-418.
- O Brien RW, White LR (1978) Electrophoretic Mobility of a Spherical Colloidal Particle. Faraday Discuss Chem Soc 74: 1607-1626.
- O Brien RW, Midmore BR, Lamb A, Hunter RJ (1990) Electroacoustic Studies of Moderately Concentrated Colloidal Suspensions. Faraday Discuss Chem Soc 90: 301-312.
- O Brien RW, Garside P, Hunter RJ (1994) The electroacoustic Reciprocal Relation. Langmuir 10(3): 931-935.
- O Brien RW (1982) The Response of a Colloidal Suspension to an Alternating Electric Field. Adv Colloid Sci 16(1): 281-320.
- O Brien RW, Rowlands WN (1993) Measuring the Surface Conductance of Kaolinite Particles. J Colloid Interface Sci 159(2): 471-476.
- O Brien RW (1986) The High-Frequency Dielectric Dispersion of a Colloid. J Colloid Interface Sci 113(1): 81-93.
- Shilov VN, Borkovskaja YB, Dukhin AS (2004) Electroacoustic Theory for Concentrated Colloids with Overlapped DLs at Arbitrary ka Application to Nano colloids and Nonaqueous Colloids. J Colloid Interface Sci 277(2): 347-358.
- Ohshima H (2004) Electrophoretic Mobility of a Soft Particle in a Salt-Free Medium. J Colloid Interface Sci 269(1): 255-258.
- Ohshima H (1998) Sedimentation Potential in a Concentrated Suspension of Spherical Colloidal Particles. J Colloid Interface Sci 208(1): 295-301.
- Ohshima H (2005) Colloid Vibration Potential and Ion Vibration Potential in a Dilute Suspension of Spherical Colloidal Particles. Langmuir 21(26): 12100-12108.
- Ohshima H, Dukhin AS (1999) Colloid Vibration Potential in a Concentrated Suspension of Spherical Particles. J Colloid Interface Sci 212(2): 449-452.
- Ohshima H (1997) Electrophoretic Mobility of Spherical Colloidal Particles in Concentrated Suspensions. J Colloid Interface Sci 188(2): 481-485.
- Ohshima H (2003) Numerical Calculation of the Electrophoretic Mobility of a Spherical Particle in a Salt-free Medium. J Colloid Interface Sci 262(1): 294-297.
- Ohshima H (2006) Electrophoresis of Soft Particles: Analytic Approximations. Electrophoresis 27(3): 526-533.
- Ohshima H (2001) Dynamic Electrophoretic Mobility of a Soft Particle. J Colloid Interface Sci 233(1): 142-152.
- Ohshima H (2007) Colloid Vibration Potential in a Suspension of Soft Particles. Colloid and Surfaces A: Physicochem Eng Aspects 306(1): 83-87.
- Dukhin AS, Goetz PJ (1996) Acoustic Spectroscopy for Concentrated Polydisperse Colloids with Higher Density Contrast. Langmuir 12(21): 4987-4997.
- Dukhin AS, Shilov VN, Borkovskaya Y, Langmuir (1999) Dynamic Electrophoretic Mobility in Concentrated Dispersed Systems. Cell Model 15(10): 3452-3457.
- Dukhin AS, Ohshima H, Shilov VN, Goetz PJ (1999) Electroacoustic for Concentrated Dispersions. Langmuir 15(10): 3445-3451.
- Dukhin AS, Ohshima H, Shilov VN, Goetz P J (2000) Electroacoustic Phenomena in Concentrated Dispersions: Effect of the Surface Conductivity. Langmuir 16(6): 2615-2620.
- Dukhin AS, Goetz PJ (2005) How Non-Ionic Electrically Neutral Surfactants Enhance Electrical Conductivity and Ion Stability in non-Polar Liquids. J Electrochemical Chem 58(1): 44-50.
- Dukhin AS, Goetz PJ, Truesdail S (2001) Titration of Concentrated Dispersions Using Electroacoustic ζ-Potential Probe. Langmuir 17(4): 964-968.
- Dukhin AS, Shilov VN, Ohshima H, Goetz PJ (1999) Electroacoustic Phenomena in Concentrated Dispersions: New Theory and CVI Experiment. Langmuir 15(20): 6692-6706.
- Dukhin AS, Goetz PJ (2002) Ultrasound for Characterizing Colloids ACS Symposium Series 878: 91-119.
- Dukhin AS, Goetz PJ (1996) Acoustic Spectroscopy for Concentrated Polydisperse Colloids with Low Density Contrast. Langmuir 12(21): 4998-5003.
- Dukhin AS, Goetz PJ (1996) Acoustic and Electroacoustic Spectroscopy. Langmuir 12(18): 4336-4344.
- Guan P, Wang M, Schlaberg HI, Khan JI, Speirs V (2011) Towards a-scan imaging via Ultrasonic Vibration Potential measurements. Nucl Eng Des 241(6): 1994-1997.
- Schlaberg HI, Wang M, Guan P, Khan JI (2011) Ultrasound Vibration Potential measurement techniques for imaging Nucl Eng Des 241(6): 1981-1987.
- Beveridge AC, Wang S, Diebold GJ (2004) Imaging Based on the Ultrasonic Vibration Potential. Appl Phys Lett 85(22): 5466.
- Khan JI, Wang M, Schlaberg HI, Guan P (2013) Effect of ion vibration potential for 1-1 electrolyte. Chem Phys 425(8): 14-18.
- Wang M, Bramson L, Khan JI (2013) NSTI Nanotech 2013 Bio Sensors, Instruments, Medical, Environment and Energy 3: 16-19.
- Gusev VE, Diebold GJ (2005) Imaging with the Ultrasonic Vibration Potential: A Theory for Current Generation. Ultrasound Med Biol 31(2): 273-278.
- Beveridge AC, Wang S, Gusev VE, Diebold GJ (2005) The Theory of Ultrasonic Vibration Potential Imaging. J Phys IV France 125: 69-72.
- Beveridge AC, Wang S, Gusev VE, Diebold GJ (2004) Vibration Potential Imaging: Theory and Preliminary Results. Proc of SPIE 5320: 95-100.
- Wang S, Nguyen CK, Li S, Hamilton T, Gusev V, Diebold G (2006) Tissue Imaging Utilizing the Ultrasonic Vibration Potential. Proc of SPIE pp.6147.


 We use cookies to ensure you get the best experience on our website.